International Journal of Mining, Materials, and Metallurgical Engineering (IJMMME)
ISSN: 2562-4571

Volume 1 - Year 2015 - Pages 1-10
DOI: TBA
Acceleration Field of Ground Vibrations and Anisotropy of Wave Propagation
Piotr Bańka
Silesian University of Technology, Faculty of Mining and Geology
Akademicka 2, Gliwice, Poland 44-100
piotr.banka@polsl.pl
Abstract - The paper presents the discussion on selected problems involving the reproduction of the acceleration field of ground vibrations basing on the pointwise registration carried out in coal mine subjected to seismic hazard. The results of investigation studies on the correlation between the registered acceleration of ground vibration and seismic energies of the tremors and their hypocenter distances are demonstrated. In the paper a regression model which allows for the anisotropy of waves propagation, by accepting the assumption that the wave front moving from the source is taking on the shape of rotational ellipsoid has been proposed. The carried out calculations show that the application of the proposed model allows us to reduce the value of standard error of the estimate as compared to the results obtained with the commonly applied regression model, which does not allow for the anisotropy of waves propagation effected by mining.
Keywords: Induced seismicity, Prediction of ground vibration, Anisotropy of wave propagation.
© Copyright 2015 Authors - This is an Open Access article published under the Creative Commons Attribution License terms. Unrestricted use, distribution, and reproduction in any medium are permitted, provided the original work is properly cited.
Date Received: 2014-12-07
Date Accepted: 2015-11-22
Date Published: 2015-11-26
1. Introduction
Hard coal mining in many mines is assisted by high-power rock mass tremors. Those tremors often generate noticeable surface vibrations, which sporadically cause damages in buildings. Calculating the intensity of ground vibrations caused by mining tremors generates numerous problems due to the fact that the intensity depends on diverse factors. The most important are [1]:
- seismic energy of a tremor,
- the depth of the focus and the epicentral distance of an observation point,
- the source mechanism,
- the centre’s geological structure, especially local ground conditions at the point of observation - the type and thickness of loose overburden, its watering as well as the area topography.
The increasingly perfect equipment used to register seismicity induced by mining works as well as the development of interpretative methods enabled an increase in precision of determining the energy of mining tremors; in consequence the growing numbers of observation network points, optimally located in relation to seismically active regions, cause a decrease in errors concerning localization of tremors hypocentres [2]. Modern digital seismological equipment makes it possible to determine the mechanism of tremors focuses. Thanks to that it is possible to analyse the influence of this factor on the intensity of surface vibrations [e.g. 3]. The influence of overburden’s structure on the magnitude of surface vibrations is also a subject matter of many researches, mainly those concerning global seismology, but the results are adapted to the issue of ground vibrations generated by mining tremors.
Generally, the methods to estimate amplification of ground vibrations are classified in the following categories [4]:
- experimental-empirical, empirical, semi-empirical methods,
- theoretical methods (analytical, numerical),
- hybrid methods.
An example of the method belonging to the first mentioned group is HVSR method (Horizontal to Vertical Spectral Ratio) [5], whose advantage is the fact that, unlike classical methods of spectra division, registering vibrations of rock substratum is not required. The basic assumption of HSVR method is determining the ratio of the horizontal component of the acceleration spectrum of ground vibrations to the vertical component of the acceleration spectrum of ground vibrations. It is increasingly often used to determine the value of the amplification coefficient of vibrations caused by mining tremors (e.g. [6], [7]). Unfortunately, there were no records of registered surface vibrations in the conducted research, therefore it was not possible to use this method in order to determine the vibrations amplification.
While using theoretical methods it is necessary to know precisely the structure and properties of the overburden. Depending on the characteristics of the position of overburden’s layers it is possible to use a simple one-dimensional model (for a horizontal position of layers) or more complex two or three-dimensional models (for a disturbed position of layers). In order to estimate the value of the amplification coefficient the paper uses the one-dimensional solution presented in [8], which allows us to evaluate how the vibrations magnitude is influenced by a horizontal layer of the overlay covering the rock half space from which a seismic wave propagates. The application of such a simple model allowed us to reduce the number of parameters characterizing seismological properties of the centre to the minimum.
Fully objective determination of parameters of surface vibrations caused by mining tremors would require constant seismometric observations in all buildings under a dynamic impact of exploitation, which is currently virtually impossible. Determining vibrations magnitude in buildings not covered by observation is possible thanks to applying dependencies combining seismic energy of registered tremors and hypocentral distances with parameters of ground vibrations. Those dependencies are also used to determine parameters of surface vibrations which may be generated by tremors with forecast energies which assist a projected mining exploitation. They may be of regional [9] or local nature, limited to an area of one or several neighbouring mines.
In the literature we may find numerous examples of applications of various forms of attenuation relation of a selected vibration parameter – for instance [9], [10], [11], [12], [13], [14], [15], [16]. The article uses a simple relation (1) which, however, has a physical justification presented in detail in [14]. The relation is widely applicable, independently of the size of sources, both in relation to earthquakes as well as tremors induced by human activity [13].
In order to increase the precision of the description of a registered field of vibrations accelerations, an attenuation relation was also used, which was expanded with an additional component making it possible to determine the value of the coefficient of vibrations amplification in the point of installing measuring equipment – equation (3). The method of calculating relative values of the coefficient of vibrations amplifications applied here has been the subject matter of many papers, among others [17], [18] and [19].
In the case of some phenomena the widely applied, simple attenuation relations do not allow for reconstructing the values of vibrations parameters which were registered at individual measure points with an acceptable error. The paper presents a model designed by the author, which is an extension of the concept proposed in [13], allowing for anisotropy of waves propagation in a rock mass.
The results presented in the paper were obtained due to an analysis of a set of 1813 registered cases of surface vibrations which occurred in one of mines at extreme seismological risk in the Upper-Silesian Coal Basin.
2. Seismicity Induced by Carried Out Mining Works, Registered Ground Vibrations
Exploitation in the discussed mine is conducted in difficult geological and mining conditions. It is accompanied by seismic hazard, which periodically reaches a high level. High-power tremors are often strongly noticeable on the ground surface and they also cause a rockburst hazard. Energies of the strongest tremors reach extremely high values – Table 1.
Table 1 shows data concerning seismicity registered between 2006 and 2014. It is a time period for which mine geophysical services determined parameters of ground vibrations which were generated by some of the tremors above. The conducted studies include data on 1813 cases, for which maximum accelerations amplitude of ground vibrations was determined (vibrations caused by some of the tremors were registered at several measuring apparatus stands).
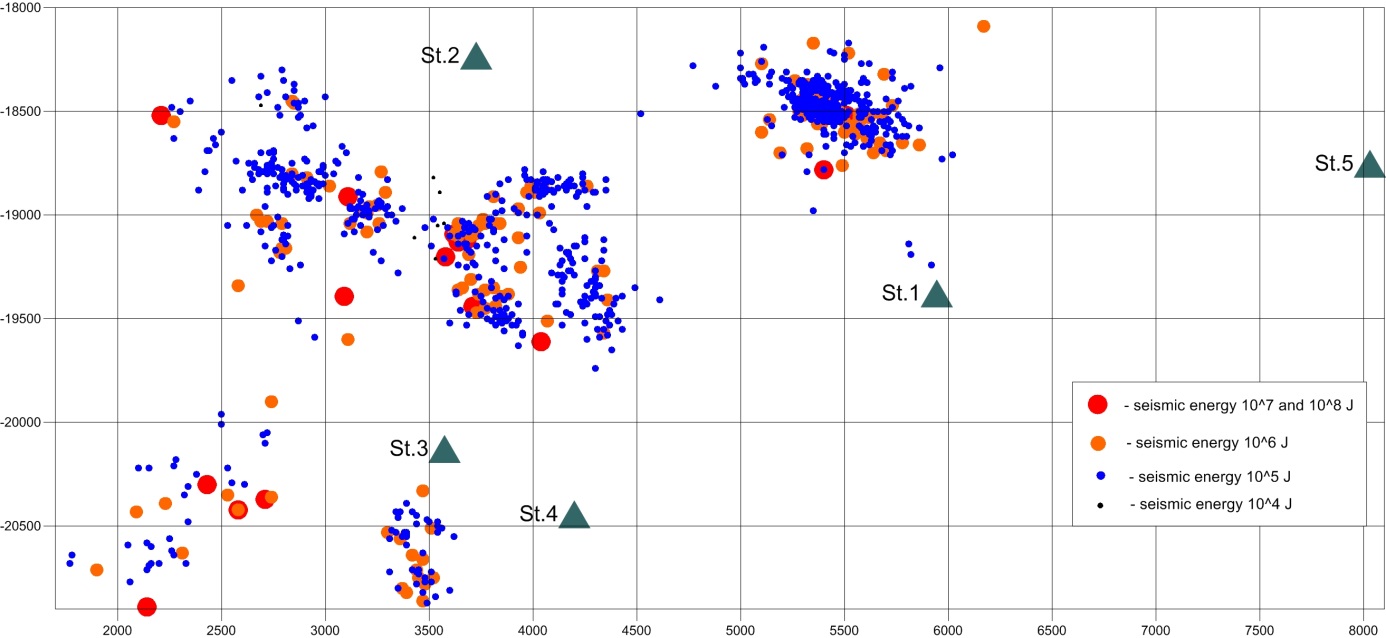
In the mine the measurements of parameters of ground vibrations caused by mining tremors are conducted by means of 5 sets of measuring apparatus. The location of seismic stations is shown in Figure 1. There are also marked tremors’ epicentres which caused the observed surface vibrations. Maximum registered accelerations of ground vibrations were 1.527 m/s2. They occurred at station St. 4 after a tremor with 8x10⁸ J source energy, which occurred on 26.05.2014 at the epicentral distance of 2108 m.
Table 1. Statistics involving the tremors registered within the years 2006 – 2014.
|
Year |
Number of tremors in classes [J] |
||||
|
103 |
104 |
105 |
106 |
107-8 |
|
|
2006 |
1338 |
861 |
290 |
43 |
2 |
|
2007 |
1049 |
763 |
249 |
29 |
1 |
|
2008 |
1109 |
278 |
81 |
8 |
3 |
|
2009 |
700 |
301 |
35 |
5 |
2 |
|
2010 |
553 |
268 |
16 |
- |
- |
|
2011 |
1404 |
488 |
64 |
3 |
- |
|
2012 |
1392 |
205 |
47 |
4 |
- |
|
2013 |
847 |
208 |
76 |
21 |
1 |
|
to 1.07.2014 |
936 |
288 |
69 |
23 |
3 |
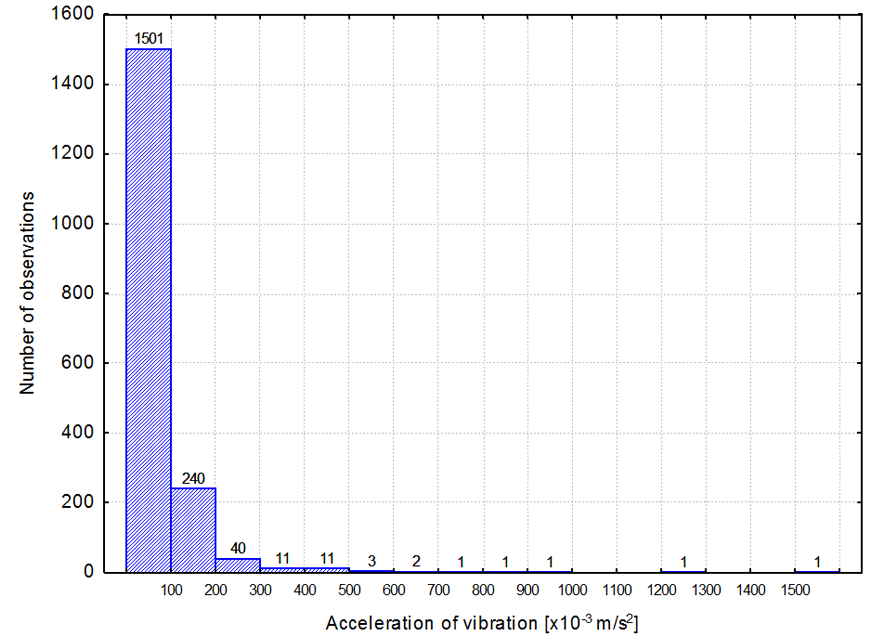
It is worth emphasizing that in a vast majority of cases maximum accelerations amplitudes of vibrations did not exceed 0.2 m/s2 – it refers to 96% of all registered vibrations (Figure 2). Only a small part of them (below 2%) was characterized by maximum accelerations amplitudes of vibrations exceeding the value of 0.3 m/s2.
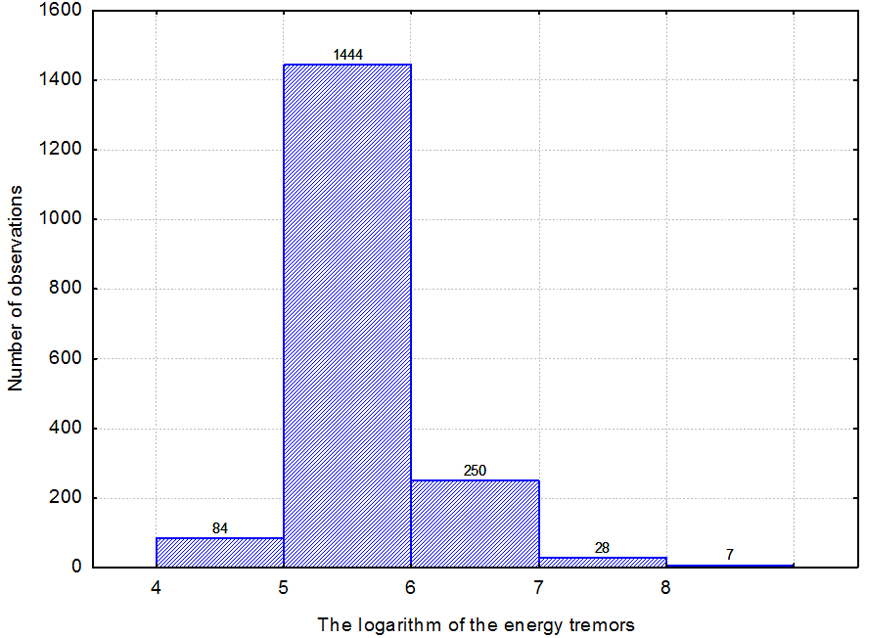
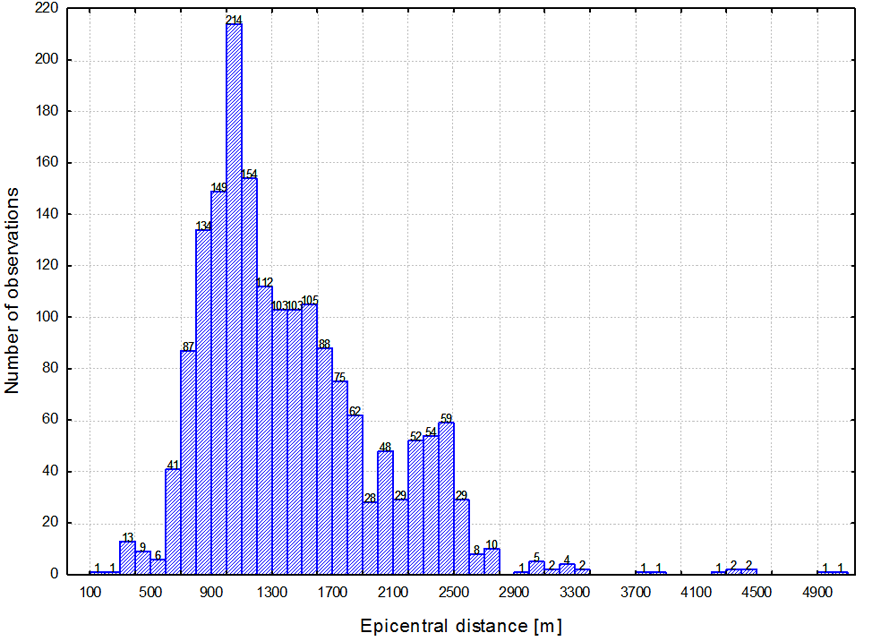
The variability interval of tremors’ energies which caused registered surface vibrations is very large and is between 2x10⁴ J and 8x10⁸ J (Figure 3). Most vibrations were caused by tremors with energies of 105 J, it refers to 80% of cases. The variability range of epicentral distances is between 137 m and 6266 m (Figure 4). Distances below 2000 m (84% of observations) are predominant.
3. Relations Between Values of Observed Ground Vibrations Accelerations and Tremors’ Energy As Well As Hypocentral Distances
Taking into account the set of observations described above there were determined parameters of a regression model of vibrations accelerations in relation to seismic energies and hypocentral distances of tremors assisting mining. As previously mentioned, the simplest regression model, but physically justified, was accepted. This model is widely applied, independent of the size of sources.
In the discussed regression model the logarithm of the maximum amplitude of vibrations accelerations is defined by the expression below:

where ![]() is maximum
amplitude of vibrations accelerations [m/s2],
is maximum
amplitude of vibrations accelerations [m/s2], ![]() denotes seismic energy of tremor [J],
denotes seismic energy of tremor [J], ![]() is hypocentral distance [m] (
is hypocentral distance [m] (![]() ;
; ![]() is
epicentral distance [m],
is
epicentral distance [m], ![]() is depth of
tremor [m],
is depth of
tremor [m], ![]() are regression model parameters and
are regression model parameters and ![]() is random component.
is random component.
Since there were analysed registrations obtained from apparatus sets located in different points of the mining area, the values of maximum accelerations of ground vibrations, before including them in calculations, were divided by the values of vibrations amplification coefficient in the measuring points. Those values were determined by applying a solution proposed in [8], which allows us to evaluate how the vibrations size is influenced by a horizontal layer of the overlay covering the rock half space from which a seismic wave propagates. The determined values of amplification coefficient oscillate within 1.4¸2.3 (Table 5).
The average depth of tremors’ foci h is selected so as to minimize the standard error of the estimation. Their real depth, determined in the process of localization of tremors, is usually not included due to serious difficulties with determining this coordinate with an acceptable error. The average depth of tremors’ foci of 500 m is very often assumed. As the conducted calculations have proved, assuming h = 500 m does not ensure minimizing the standard error of the estimation. The best results were achieved by assuming that the tremors’ depth was h = 650 m. Figure 5 shows normalized standard error of the estimation in the function of different depths of tremors’ foci.
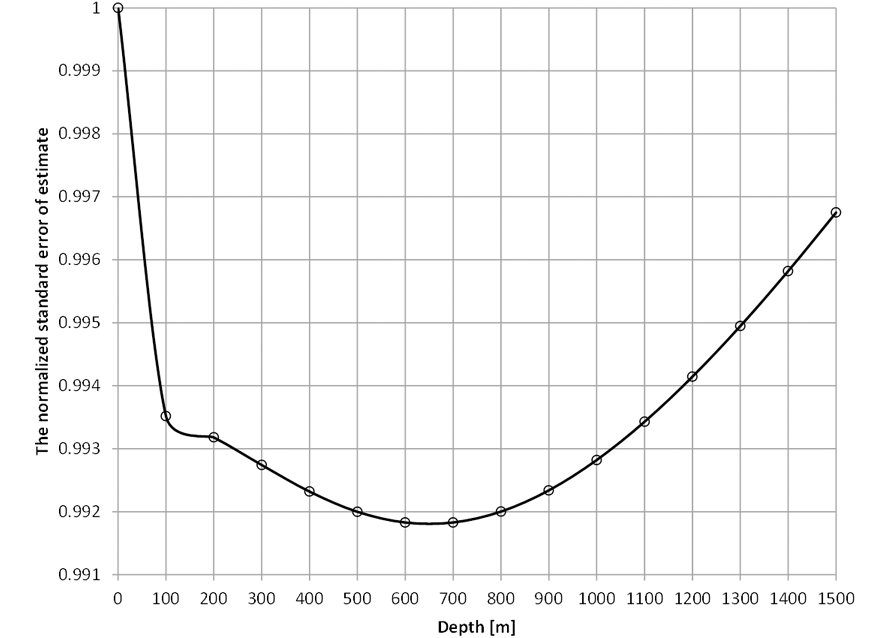
Table 2 presents estimation results of parameters of the regression model (1) conducted for a set containing data on calculated maximum amplitudes of bedrock vibrations.
Table 2. Estimation results of regression model parameters – model (1).
|
R=0.71 R2=0.50 F(3,1809)=613.91 p<0.0000 Standard error of estimation: 0.281 |
||||
|
Parameter |
Value |
Standard error |
t(1809) |
Level p |
|
|
0.852992 |
0.653023 |
1.30622 |
0.19 |
|
|
0.382241 |
0.012926 |
29.57037 |
0.00 |
|
|
-0.345442 |
0.227582 |
-1.51788 |
0.13 |
|
|
-0.000346 |
0.000056 |
-6.13291 |
0.00 |
On the basis of the results of Fischer-Snedecor F test there are no grounds to assume that the regression is unessential. The calculations results of t-student’s test for regression coefficients show that on the arbitrarily assumed significance level of 0.9 there is no basis for rejecting hypotheses about zeroing of parameters ɑ3 and ɑ4. As a result, it was decided to modify model (1) by eliminating variable logR from it.
The following model was assumed in further analyses:

The estimation results of the parameters of the regression model (2) are presented in table 3.
Table 3. Estimation results of regression model parameters – model (2).
|
R=0.71 R2=0.50 F(2,1810)=919.05 p<0.0000 Standard error of estimation: 0.281 |
||||
|
Parameter |
Value |
Standard error |
t(1809) |
Level p |
|
|
-0.131961 |
0.073282 |
-1.8007 |
0.07 |
|
|
0.385595 |
0.012741 |
30.2644 |
0.00 |
|
|
-0.000430 |
0.000012 |
-34.5995 |
0.00 |
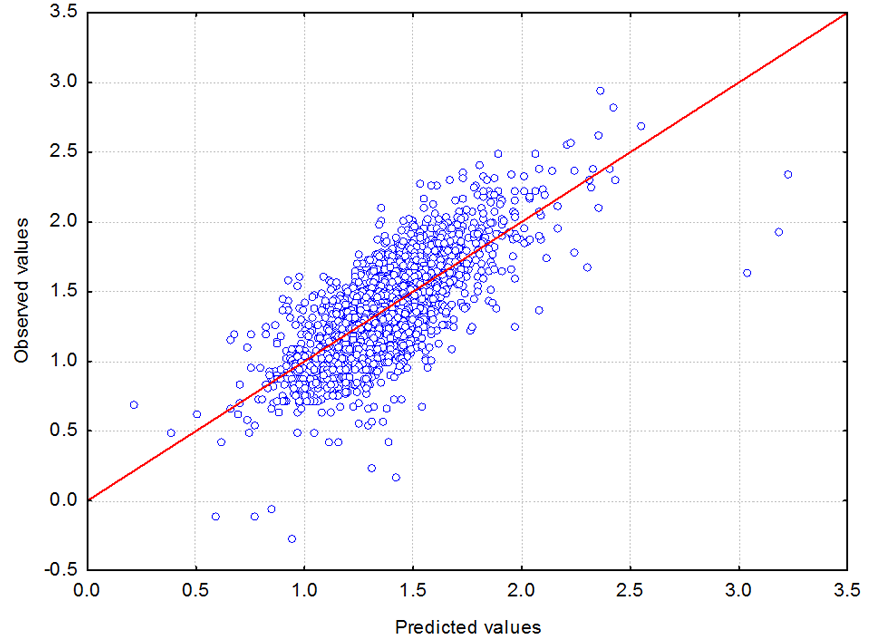
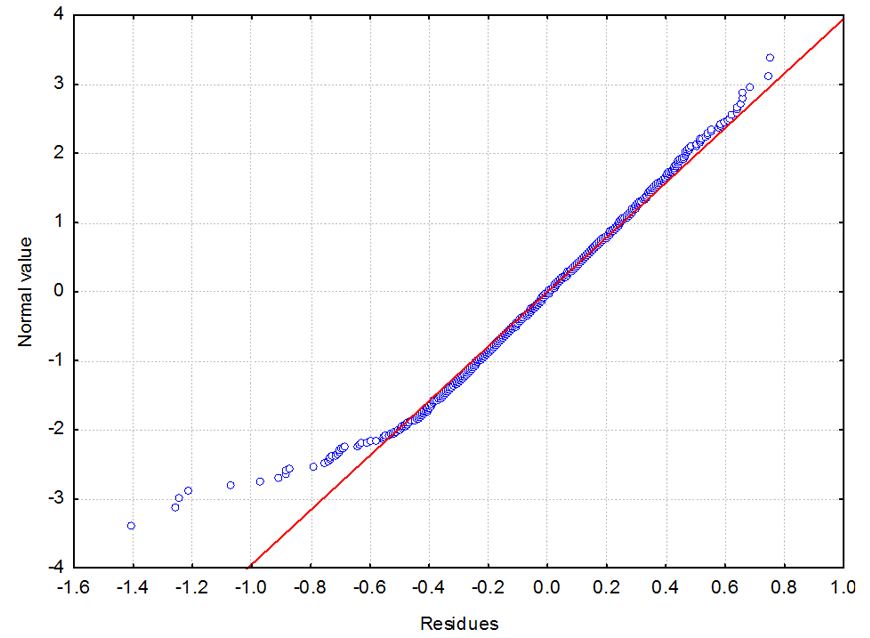
The value of the determination coefficient is 0.50. It means that the determined regression equation makes it possible to explain 50% of the observed variability of maximum accelerations amplitudes of ground vibrations. The conducted analyses of distributions of residual variables have shown no errors in the model which would require its modification. Figure 6 shows graph of the dispersion of observed and predicted values and Figure 7 shows graph of residual normality plot.
The results of the conducted regression analysis show that by assuming values of maximum amplitudes of surface vibrations instead of values calculated for a bedrock it is possible to obtain a better adjustment (a smaller value of the standard error of estimation) - table 4.
Obviously, it does not mean that the variable amplification coefficient does not influence the registered magnitude of surface vibrations. It only shows relatively large errors in its estimation. As a result, an attempt has been made to use the measurement results to determine the values of amplification coefficient of vibrations through a loose Quaternary substratum. The values of amplification coefficient of vibrations in positions of seismic stations were determined by minimizing the function:
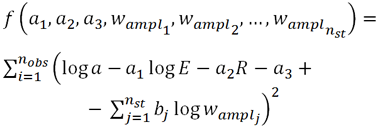
where ![]() is the value of amplification coefficient of
vibrations in the point of installing apparatus ‘j’,
is the value of amplification coefficient of
vibrations in the point of installing apparatus ‘j’, ![]() are controlling parameters; bj
= 1 if the ‘ i-th’ record was registered at ‘j-th’ stand and bj
= 0 in the opposite case; j = 1 …. nst,
are controlling parameters; bj
= 1 if the ‘ i-th’ record was registered at ‘j-th’ stand and bj
= 0 in the opposite case; j = 1 …. nst, ![]() is the number of analysed vibrations records,
is the number of analysed vibrations records, ![]() denotes the number of measuring apparatus
stands, other denotations – as above.
denotes the number of measuring apparatus
stands, other denotations – as above.
Table 4. Estimation results of regression model parameters – model (2), surface vibrations.
|
R=0.71 R2=0.50 F(2,1810)=921.61 p<0.0000 Standard error of estimation: 0.274 |
||||
|
Parameter |
Value |
Standard error |
t(1809) |
Level p |
|
|
0.162383 |
0.071604 |
2.2678 |
0.02 |
|
|
0.375337 |
0.012449 |
30.1497 |
0.00 |
|
|
-0.000422 |
0.000012 |
-34.7776 |
0.00 |
Additional limitations
of the form was assumed: ![]() ,
, ![]() (i.e.
(i.e. ![]() ) – due to the undetermined problem.
) – due to the undetermined problem.
In
the process of searching for the minimum of function f (ɑ 1,
ɑ 2, ɑ 3, wampl 1,
wampl 3, …., wampl 5)
an evolutionary algorithm was used. Due to the used minimization algorithm it
was necessary to introduce limitations for other variables as well. The
limitations were determined in such a way so as not to influence the obtained
solution: ![]() ,
, ![]() ,
, ![]() .
.
Table 5 shows the values of the amplification coefficient of vibrations determined on the basis of observations of vibrations accelerations. The table also presents the parameter’s values calculated analytically.
Table 5. Determined values of the amplification coefficient of vibrations.
|
Seismic station |
Number of observations |
Value of the amplification coefficient |
|
|
Calculated analytically |
Detremined on the basis of observations |
||
|
St. 1 |
357 |
1.5 |
3.2 |
|
St. 2 |
318 |
1.4 |
1.4 |
|
St. 3 |
661 |
2.3 |
2.3 |
|
St. 4 |
468 |
1.7 |
1.8 |
|
St. 5 |
9 |
1.5 |
2.9 |
In the case of stations St. 3 and St. 4 the obtained results are equal or very similar whereas in the case of stations St. 1 and St. 5 there are significant differences between the values of amplification coefficients determined analytically and as a result of the conducted minimization. One of the reasons for the differences may be uncertain estimation for station St. 5 resulting from a small number of measurements considered during calculations. With reference to station St. 1 the variances may be explained by wrong identification of the structure of subsurface layers of overlay or by an inaccurate choice of seismogeological parameters considered in analytical calculations.
For the sake of the regression analysis there were assumed values of maximum amplitudes of surface vibrations divided by the value of amplification coefficients determined from measurements and there were found a higher value of determination coefficient and a lower value of the standard error of estimation – Table 6.
The determined regression equation may be used to define the values of maximum amplitudes of constituent horizontal accelerations of ground vibrations in the points not included in measurements. For this reason it is necessary to determine the distribution of the values of vibrations’ amplification coefficient for those points. The values may be calculated analytically, by assuming the values of seismogeological parameters verified on the basis of the measurements results – the parameters should be selected in such a way that the results of analytical calculations could correspond to estimations obtained as a result of minimizing function (3).
Table 6. Estimation results of regression model parameters – model (2), values of the amplification coefficient determined on the basis of observations.
|
R=0.74 R2=0.55 F(2,1810)=1186.9 p<0.0000 Standard error of estimation: 0.252 |
||||
|
Parameter |
Value |
Standard error |
t(1810) |
Level p |
|
|
-0.404979 |
0.065644 |
-6.1693 |
0.00 |
|
|
0.388220 |
0.011445 |
33.9208 |
0.00 |
|
|
-0.000372 |
0.000010 |
-36.5361 |
0.00 |
While applying the regression equation to calculate the values of ground vibrations accelerations, we have to realize that making those estimations for the value of seismic energy and epicentral distance, not considered to estimate the model’s parameters and also in another seismically threatened area, may cause extremely big forecast errors. It is also worth emphasizing that there may occur bigger vibrations than the ones calculated from equation (2) because of applying the regression analysis method to determine the vibrations parameters. Statistically it refers to 50% of observations. The upper limit of the confidence interval determines which values will not be exceeded with a given probability [20]. Using the limits of the confidence interval we may assume with a given probability (e.g. 90%) that the observed maximum accelerations of ground vibrations induced by a tremor with a definite seismic energy and occurring in a definite epicentral distance will be found in the calculated confidence interval. Conducting forecasts without taking into account the upper limit of the confidence interval is in many cases burdened with a risk of a serious underestimation of the observed maximum values of the accelerations amplitudes of vibrations.
4. An Attempt to Explain the Diversity of the Registered Vibrations Accelerations Through Considering Vibrations Propagation Anisotropy
After an occurrence of tremors induced by mining activities we can often observe a strong diversity of the registered maximum accelerations amplitudes of ground vibrations at individual measuring stations. More than once in the points of the observation network situated closer to the tremor’s epicentre there are registered maximum amplitudes of vibrations lower than in the points situated farther away. It can be explained by the diversity of the vibrations amplification coefficient. Vibrations propagation anisotropy may be another method to explain the phenomenon.
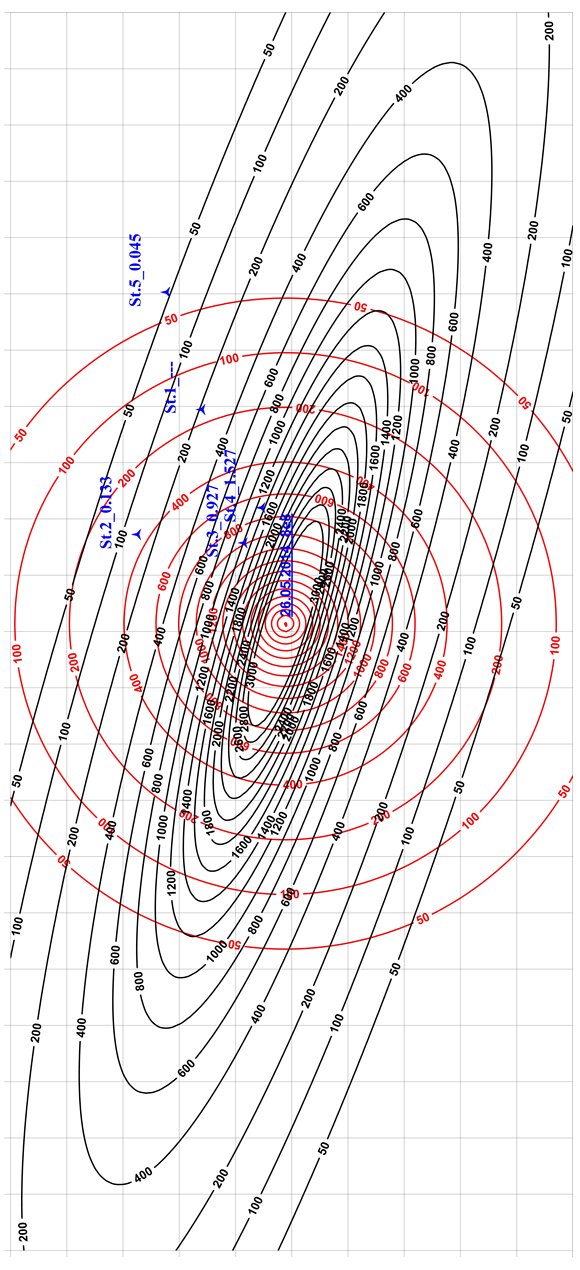
In the whole period of conducting observations the strongest surface vibrations were induced by a tremor which occurred on 26.05.2014. The tremor caused vibrations whose maximum accelerations amplitudes are presented in Table 8. Due to a regional character of the tremor, different from the majority of the registered ones, as well as because of its high seismic energy the estimated values of the vibrations amplification coefficient may be inadequate. However, our attention should be drawn to the fact that at station St. 3 situated closer to the epicentre in comparison to station St. 4, despite a higher value of vibrations amplification coefficient, there were observed vibrations with smaller maximum accelerations amplitudes of vibrations. The phenomenon may be explained by the vibrations propagation anisotropy.
Due to a different, mentioned above, character of the discussed tremor, visible, among others, in much lower dominating frequencies of vibrations in comparison to the most often observed ones, the differentiation of the vibrations amplification coefficient, whose value is strongly dependent on vibrations frequency, was not taken into account in further analyses.
An attempt to describe the accelerations field of surface vibrations caused by the studied tremor applying model (2), whose parameters were estimated by using all vibrations registrations, failed – Table 8. A large underestimation was noted of the observed maximum accelerations amplitudes of ground vibrations as well as high values of the mean-square reproducibility error. In the case of determining the regression equation only on the basis of observations of vibrations accelerations caused by the tremor of 26.05.2014 – model (2*) (Table 7) – there were also obtained adjustment results characterised by a major error and underestimation – Table 8.
Table 7. Estimation results of regression model parameters – model (2*).
|
R=0.90 R2=0.80 F(1,2)=8.1902 p<0.10349 Standard error of estimation: 0.38853 |
||||
|
Parameter |
Value |
Standard error |
t(1810) |
Level p |
|
|
3.540506 |
0.417560 |
8.47904 |
0.01 |
|
|
-0.000314 |
0.000110 |
-2.86185 |
0.10 |
Table 8. Observed and predicted maximum accelerations amplitudes of ground vibrations caused by the tremor which occurred on 26.05.2014.
|
Seismic station |
Epicentral distance [m] |
Maximum accelerations amplitudes of ground vibrations [m/s2] |
|||
|
Observed |
Model (2) |
Model (2*) |
Model (5) |
||
|
St. 1 |
4095 |
lack of observation |
|||
|
St. 2 |
3096 |
0.133 |
0.107 |
0.360 |
0.133 |
|
St. 3 |
1626 |
0.927 |
0.668 |
0.981 |
1.183 |
|
St. 4 |
2108 |
1.527 |
0.404 |
0.711 |
1.293 |
|
St. 5 |
6266 |
0.045 |
0.013 |
0.039 |
0.045 |
|
The value of mean square error [m/s2] |
0.577 |
0.424 |
0.173 |
||
|
The maximum underestimation [m/s2] |
1.123 |
0.816 |
0.234 |
||
The model of ellipsoidal anisotropy proposed in [21] was used to describe the analysed observation results of ground vibrations accelerations in the following form:

where ![]() ,
,
![]() ,
,
![]() ,
,
![]() ,
,
![]() ,
,
![]() ,
,
![]() are coordinates of tremor,
are coordinates of tremor, ![]() ,
, ![]() ,
, ![]() are coordinates of seismic station,
are coordinates of seismic station, ![]() are parameters;
are parameters; ![]() and other denotations – as above.
and other denotations – as above.
Model (4), which is an extension of the model proposed in [13], allows us to consider anisotropy of waves propagation both along axis x, y as well as z by assuming that the front of the wave moving from the source takes on the shape of a ellipsoid. A possibility was assumed that the ellipsoid rotates on axis z through q angle.
As it was assumed in earlier calculations, the depth of the tremor’s focus is 700 m and the variable log R* was omitted. Due to a small number of observations a constant value of parameter r = 1 was assumed. A parameter connected with the tremor energy was also removed from the model due to its constant value. Ultimately, the model’s form is as follows:

where ![]() , other denotations – as above.
, other denotations – as above.
The values of the model’s parameters were determined using an evolutionary algorithm. The norm L1 of the objective function was being minimized. The estimation results of the regression model’s parameters are presented in Table 9. The values of hypocentral distance R* change from 5554 m to 19590 m.
Obviously, such good results of adjusting model (5) to the measurement data come from a small number of registrations considered in calculations of the values of the model’s parameters, which are equal to its number. However, it is worth emphasizing that it is an only one of the considered models which enabled a relatively accurate description of observed highest maximum accelerations amplitudes of constituent horizontal vibrations (Figure 8). The value of the mean-square error decreased over threefold in comparison to the one determined as a result of the model’s (2) application and over twofold in comparison to model (2*) and was 0.173 m/s2 (Table 8).
Table 9. Estimation results of the regression model’s parameters – anisotropy of waves propagation, analysed vibrations caused by a tremor with the energy of 8x10⁸J (26.05.2014).
|
R = 0.99 R2 = 0.99 F(1,2) =191.2 p<0.00519 Standard error of estimation: 0.08923 Value of parameters: p = 4.9989 q = 1.2704 r = 1 |
||||
|
Parameter |
Value |
Standard error |
t(1810) |
Level p |
|
|
3.666429 |
0.096534 |
37.9809 |
0.01 |
|
|
-0.000103 |
0.000007 |
-13.8276 |
0.01 |
5. Conclusion
A great number of registered courses of vibrations allows us to determine increasingly precisely the parameters of ground vibrations induced by mining activities. Using the attenuation relation which includes an additional component making it possible to determine the amplifications coefficient allowed to improve the quality of adjusting measurement data to the calculated values of vibrations parameters (the value of determination coefficient R2 increased from 0.50 to 0.55, the standard error of estimation decreased from 0.281 m/s2 to 0.251 m/s2 ).
A growing number of observations also enables a construction of a more complicated model of waves propagation in a rock mass, which can translate into an increase in the accuracy of conducted assessments of surface vibrations parameters. The paper presents a model designed by the author, which allows to take into account anisotropy of waves propagation in a rock mass. A simple modification of the widely used regression model allows us to obtain a more accurate description of the field of registered maximum amplitudes of accelerations. Calculations conducted for a selected case of the largest observed amplifications of ground vibrations caused by a regional tremor allowed to notice an extremely distinct effect of anisotropy of vibrations propagation in a rock mass. Only after including this phenomenon was it possible to reconstruct correctly the observed field of vibrations amplifications (the value of determination coefficient R2 increased from 0.80 to 0.99, the standard error of estimation decreased from 0.389 m/s2 to 0.089 m/s2).
References
[1] S. J. Gibowicz, "Problems connected with assessing seismic risk in mining areas," in 2nd National Symposium on Surface Protection from Mining Damage, 1985.
[2] S. J. Gibowicz and A. Kijko, An Introduction to Mining Seismology, San Diego: Academic Press, 1994. View Book
[3] B. Orlecka-Sikora, S. Cesca, S. Lasocki, G. Lizurek, P. Wiejacz, Ł. Rudziński, P. Urban and M. Kozłowska, "Seismogenesis of exceptional ground motion due to a sequence of mining induced tremors from Legnica-Głogów Copper District in Poland," Geophysical Journal International, vol. 198, no. 1, pp. 40-54, 2014. View Article
[4] K. Pitilakis, "Site effects," in Recent Advances in Earthquake Geological Engineering and Microzonation, Dordrecht, Kluwer Academic Publishers, 2004, pp. 139-167. View Book
[5] Y. Nakamura, "A Method for Dynamic Characteristics Estimation of Subsurface using Microtremor on the Ground Surface," Quarterly Report of Railway Technical Research Institute, Tokyo, 1989. View Article
[6] D. Olszewska and S. Lasocki, "Application of the horizontal to vertical spectral ratio technique for estimating the site characteristic of ground motion caused by mining induced seismic events," Acta Geophysics, vol. 52, no. 3, pp. 301–318, 2004. View Article
[7] A. Frej and W. M. Zuberek, "Local effects in peak accelerations caused by mining tremors in Bytom Syncline region (Upper Silesia)," Acta Geodyn. Geomater., vol. 5, no. 2 (150), pp. 115–122, 2008. View Article
[8] E. F. Sawarenski, "Elementary assessment of the impact layer on the earth's surface vibrations," in Academy of Sciences USSR series Geophysics, 1959.
[9] G. Mutke, "Method of forecasting parameters of substrate vibrations generated by mining tremors in the area of Upper-Silesian Coal Basin," unpublished.
[10] W. B. Joyner and D. M. Boore, "Peak horizontal acceleration and velocity from strong-motion records including records from the 1979 Imperial Valley, Clifornia Earthquake," Bull. Seismol. Soc. Am., vol. 71, no. 6, pp. 2011-2038, 1981. View Article
[11] D. M. Boore and W. B. Joyner, "The empirical prediction of ground motion," Bull. Seismol. Soc. Am., vol. 72, no. 6B, pp. 43-60, 1982. View Article
[12] G. M. Atkinson and D. M. Boore, "Earthquake ground-motion prediction equation for eastern North America," Bull. Seismol. Soc. Am., vol. 96, no. 6, pp. 2181-2205, 2006. View Article
[13] S. Lasocki, M. Szybiński, J. Matuszyk, J. Mirek and A. Pielesz, "Prediction of surface vibrations caused by seismic events from mines: a critical review," in Workshop 2000 "Natural hazards in mining, 2000.
[14] E. Markowski, J. Kornowski and W. M. Zuberek, "Summary and analysis of results of surface observations of accelerations caused by mining tremors from mining plants united in Bytom Mining Company PLC between 1998-2000," Polish Society of Friends of Earth Sciences in Upper-Silesia, Sosnowiec, 2002.
[15] J. Kornowski, "Regional and local forecast of maximum accelerations from mining tremors," Mining and Environment, Scientific Works The Main Mining Institute, vol. III/2006, pp. 243-254, 2007.
[16] J. Kurzeja, "Verification of selected maximum accelerations estimators for tremors in the Upper Silesia region," Mineral resources management, vol. 24, no. 2/3, pp. 291-302, 2008. View Article
[17] A. Frej, "The estimation of attenuation relations with the amplification of vibration for chosen Bytom regions," Mineral resources management, vol. 24, no. 2/3, pp. 303-312, 2008. View Article
[18] A. Golik and M. J. Mendecki, "Ground-Motion Prediction Equations for Induced Seismicity in the Main Anticline and Main Syncline, Upper Silesian Coal Basin, Poland," Acta Geophysica, vol. 60, no. 2, pp. 410-425, 2012. View Article
[19] D. Olszewska and S. Lasocki, "The attenuation relations of the peak value of ground vibrations acceleration including amplification for selected regions of Legnica and Głogów Copper Area," in Mining Workshop 2006 Natural Hazards in Mining, 2006.
[20] N.R. Draper, H. Smith, Applied Regression Analysis, Poland: Polish Scientific Publishers, 1973.
[21] P. Bańka "Selected issues of the description of ground vibrations caused by mining tremors," Polish Mining Review, no. 5, pp. 31-41, 2013. View Article