International Journal of Mining, Materials, and Metallurgical Engineering (IJMMME)
ISSN: 2562-4571

Volume 6 - Year 2020 - Pages 18-26
DOI: 10.11159/ijmmme.2020.002
Optimization of Processing parameters on Low Temperature Plasma Nitriding of AISI 420 Martensitic Stainless Steel
Insup Lee1
1Dongeui University
Department of Advanced Materials Engineering, Dongeui University 47340
Busan, Republic of Korea
islee@deu.ac.kr
Abstract - Low temperature plasma nitriding was performed in order to study the effect of processing parameters like treatment time, nitrogen and carbon content on the expanded martensite layer (α'N layer) of the AISI 420 martensitic stainless steel. Plasma nitriding was carried out for various times from 4 to 15 h, with changing the nitrogen content from 10% to 35 % and carbon content from 0% to 6% at fixed temperature of 400°C. The surface hardness and α'N layer thickness values increases with increasing processing time and increasing the nitrogen content. Contrary, these values decreases with increasing the methane content. The highest surface hardness (around 1330 HV0.1) and highest α'N layer thickness (around 33 µm) were achieved when treated with 25% nitrogen content for 15 h. Although, this longer processing time exhibits poor corrosion resistance. The corrosion resistance decreases with increasing methane content. Best corrosion resistance is achieved when treated with 25% nitrogen content for 6 h, without any methane content.
Keywords: AISI 420 martensitic stainless steel, α'N layer, Corrosion resistance, low temperature plasma nitriding, hardness.
© Copyright 2020 Authors This is an Open Access article published under the Creative Commons Attribution License terms. Unrestricted use, distribution, and reproduction in any medium are permitted, provided the original work is properly cited.
Date Received: 2019-10-17
Date Accepted: 2018-12-03
Date Published: 2020-02-19
1. Introduction
Stainless steels are well known for its excellent corrosion resistance which is the reason behind its popularity in different industrial purposes. However, most stainless steels have low hardness and therefore poor resistance to wear unless a surface modification treatment is applied. The martensitic grades of stainless steels are thus mainly used where hardness, strength, and wear resistance are required in the tools and automotive industry as well as in jewelry manufacturing, food storage and weaponry. AISI 420 martensitic stainless steel is a high chromium mold steel and has a martensitic microstructure. Having reasonable corrosion resistance, shock resistance and high plasticity, AISI 420 martensitic stainless steel has been widely used in manufacturing turbine blades and valve parts. Nevertheless, its industrial applications are limited due to low hardness and poor wear resistance [1]. The improvement of these surface properties can be done by thermochemical process like low temperature plasma assisted nitriding. Studies show that in austenitic stainless steel, improved surface can be achieved due to the formation of S-phase (expanded austenite phase) [2]. Meanwhile in martensitic stainless steel the formed layer is called α'N layer (expanded martensite layer), as reported by Kim et al. [3], which helps to improve the surface hardness and wear resistance. If processing parameters are chosen optimizely, obtaining a treated surface having higher hardness and corrosion resistance than the untreated surface, is possible [4-6]. However, if the process parameters are not correctly selected, the treated surface can present a corrosion resistance lower than that expected for the bulk material after adequate solution treatment, which must be strongly avoided particularly on the case of stainless steels. In the present work, investigations are done on the surface modifications by plasma nitriding on AISI 420 martensitic stainless steel to observe the effect of different processing time, the effect of various N2 content and the effect of carbon by introducing methane gas in the nitriding environment.
2. Experimental Procedure
Circular coupons of solution treated AISI 420 martensitic stainless steel of 16 mm diameter and 3 mm thickness were prepared for the treatment. It is generally known that the solution treatment was done at 1050°C for 30 mins/inch and then quenched in water. The composition of AISI 420 martensitic stainless steel is given in the Table I. The solution treated samples are denoted as “bare” in this paper. The surfaces of the circular coupons were mirror polished by means of automatic polishing machine and then cleaned before starting the plasma treatment. Then, the samples were placed on the cathode table in the plasma ion nitriding system. The next step is pre-sputtering operation. Plasma chamber has to evacuate below 50 mTorr before starting this operation. During this operation Ar and H2 ion sputtering was performed for at least 40 minutes for further surface cleaning. After sputtering, plasma nitriding process was immediately carried out at 400°C temperature for various time (4h to 15hr), with changing N2 percentage (10% to 35%) and with introducing various amount of CH4 (0% to 6%) in the glow discharge environment in a gas mixture of N2 and H2 and at 4.0 Torr vacuum pressure and 400V discharge voltage. According to L. Mariano et. al. [7], at higher temperature (>450°C) the surface hardness of AISI 420 martensitic stainless steel decreases. Thus, the temperature was chosen as 400°C, according to their results.
Table 1. Chemical compositions (wt.%) of AISI 420 martensitic stainless steel.
| Materials | Fe | C | Si | Mn | P | S | Ni | Cr | Mo | Cu |
| AISI 420 | Bal. | 0.286 | 0.404 | 0.719 | 0.0266 | 0.0036 | 0.231 | 13.484 | 0.093 | 0.123 |
After treatment, the samples were cooled in the vacuum chamber up to the room temperature. The plasma nitrided samples were sectioned for metallographic examination and surface hardness determination. The samples were cut, mounted, polished and finally the cross-sectional surfaces were etched with Vilella’s reagent (1g picric acid + 100 ml Ethyl alcohol + 5 ml HCl). The microstructures of the surface of all the samples were observed by using an Olympus BX51M optical microscope. A Rigaku D/Max-200 X-ray diffractometer was employed to analyze different phases formed on the treated surfaces by using Cu-Kα radiation (λ= 1.544 Å). Micro hardness measurements were carried out with the digital Micro Vickers hardness tester Matsuzawa MMT-X7B using an indentation load of 0.98N (100g) and a loading time 10 seconds. Glow discharge optical emission spectrometry (GDOES) analysis of the treated samples was also performed to analyze the distribution of nitrogen and carbon in the crystal lattice. A potentiodynamic polarization technique was applied to estimate the corrosion characteristics of the plasma nitrocarburized layer in a 3.5% NaCl solution by using Princeton Applied Research VersaSTAT 3 potentiostat. For reference electrode 3.5% KCl Ag/AgCl was selected and platinum (Pt) was used for the counter electrode. The anodic polarization curves were recorded with a sweep speed of 1 mV/sec. Higher corrosion potential (Ecorr) and lower current density (icorr) indicate higher corrosion resistance.
3. Results and Discussion
3. 1. Effect of Processing Time
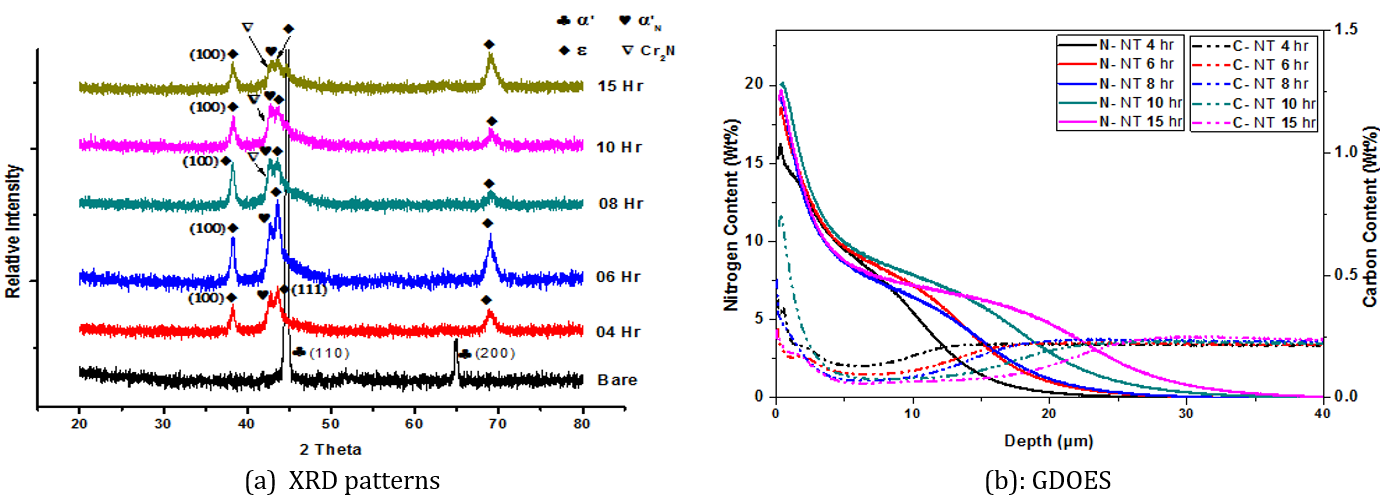
Figure 1 (a) shows the XRD patterns of AISI 420 martensitic stainless steel samples nitrided at 400°C and with 25% nitrogen content for various processing time starts from 4 h to 15 h. Figure 1(a) shows that the untreated sample (bare) produced two diffraction peaks of α'(110) and α'(200) in the range of 20-80°. Figure 1(a) also indicates that, the surface of the nitrided samples mainly consists of α'N and ε-Fe2-3N. The 2θ values of α'N peak and ε- Fe2-3N peak are very close to each other, they even overlapped to each other in some patterns. As α'N layer is formed due to the solid solution of nitrogen, it expanded the lattice planer spacing of α'(110) and shifted the (110) peak of α' toward a lower diffraction angle in the XRD pattern. According to Bragg’s law, lower 2θ angle indicates the increase in d-spacing of crystal planes i.e. increase the volume of unit cell. Thus, this shift of 2θ angle confirms the formation of the α'N layer as suggested by Kim et al. [3]. Moreover, the presence of Cr2N peaks on 8h, 10h and 15h treated samples indicates the poor corrosion behavior. The formation of Cr2N precipitates results in a decrease in the corrosion resistance. The Cr2N precipitates in the nitrogen enriched layer will cause chrominum depletion in their vicinity and eventually prevent the generation of a thin Cr2O3 surface film, termed a passive film. Therefore Cr2N precipitation is the limiting factor to maintain corrosion resistance in plasma nitriding of stainless steel. It was reported that nanometric Cr2N precipitates formed in a nitrogen saturated region. The size of precipitates is found to be larger at the surface than at the nitride layer – steel interface. These chromium nitrides form dark spots on the α'N layer which can be seen in Figure 2(b & c). Also the sharpness of all the peaks increases with increasing processing time up to 6h. But the intensity of all the peaks become weaker and blunter with increasing processing time from 8h to 15h. It is the evidence that the nitrogen supersaturated martensite forms a stable condition for 6h treatment. From this phenomena, it can be assumed that, increasing the processing time for more than 6h, forces the supersaturated-nitrogen to come out of the martensite matrix and forms chromium nitride which decreases the corrosion resistance.
GDOES analysis are manifested in Figure 1(b). Nitrogen occupies deeper region from the surface with increasing the processing time. Longer processing time, gives nitrogen enough time and energy to diffuse through the surface to cover more depth. Due to high concentration gradient in the surface, longer processing time increases the diffusion depth of nitrogen and hence increase the thickness of nitrogen-supersaturated martensite (α'N) layer. Comparing the GDOES data with the microstructure (from Figure 2), it can be verified that the depth covered by nitrogen represents the thickness of α'N layer. Moreover, it can be seen from the GDOES analysis that carbon in the matrix is substituted by nitrogen in the α'N layer region, which decreases the carbon content (wt%) values near the surface. And the values are restored to their original base value just below the end point of α'N layer.
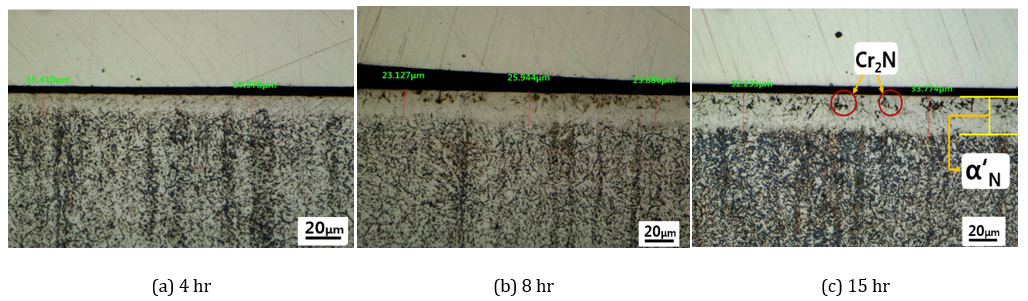
Figure 2 shows the cross section micrographs of the AISI 420 martensitic stainless steel samples, nitrided at 400°C for 4, 8 and 15 h. From the figure, it can be shown that the layer thickness increases with increasing processing time. It is also clear from the Figure 2 that the dark spots, visible in the α'N layer, increases with increasing processing time from 8h to 15h. These dark spots are the formation of chromium nitrides, which are detrimental for the corrosion behavior of the samples.
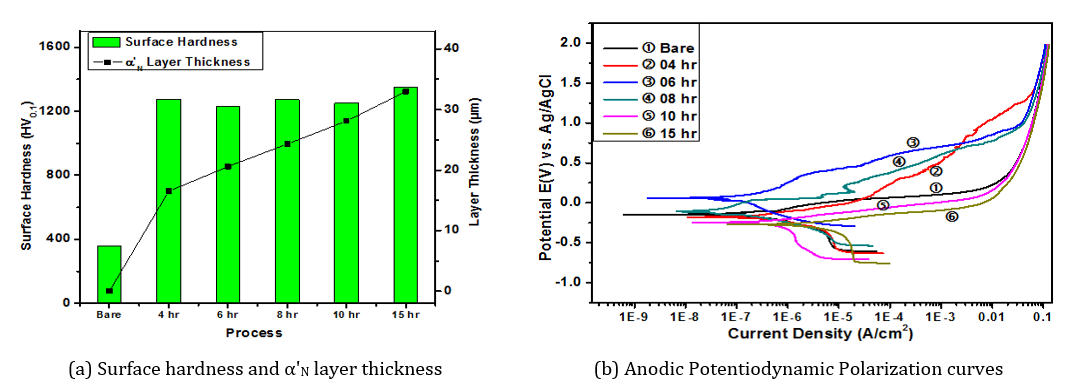
The changes of surface hardness and α'N layer thickness with increasing processing time are shown in Figure 3(a). The α'N layer thickness increases from around 16 µm to 33 µm, when processing time was increased from 4 h to 15 h. The surface hardness values are almost same (around 1300 HV0.1) for all these samples, which is almost four times higher than the surface hardness of bare sample (around 358 HV0.1).
The anodic polarization curves of the untreated (bare) and treated samples with various processing time, in 3.5% NaCl aqueous solution, are shown in Figure 3(b). There is no passivation region in the bare sample. In addition, the current density increased at a high rate immediately after the corrosion potential exceeds 60 mV. This rapid increase in current density during polarization test of stainless steel is known to be caused by the breakdown of the passive film on the surface, followed by localized corrosion. The corrosion behavior improves initially with increasing processing time from 4h to 8h. The corrosion potential (Ecorr) was changed from -147 mV for the bare sample to around -178 mV, 60 mV and -110 mV respectively for the 4h, 6h and 8h nitrided sample, even though there is no passivation region. Also the current densities of those nitrided samples were quite same, suggesting that the corrosion rate of the samples are almost same as the untreated one. On the other hand beyond 8 h treatment, increasing processing time decreases the corrosion resistance of the treated samples. Ecorr value was decreased to about -246 mV and -270 mV respectively for the 10h and 15h treated sample which is much lower than the bare one. In addition, corrosion current densities of this two samples are one to two orders of magnitude higher than that of bare sample, indicating the faster corrosion rate of these samples. This happens certainly for the presence of Cr2N in the layer, which was confirmed by XRD in Figure 1(a).
3. 2. Effect of Nitrogen percentage
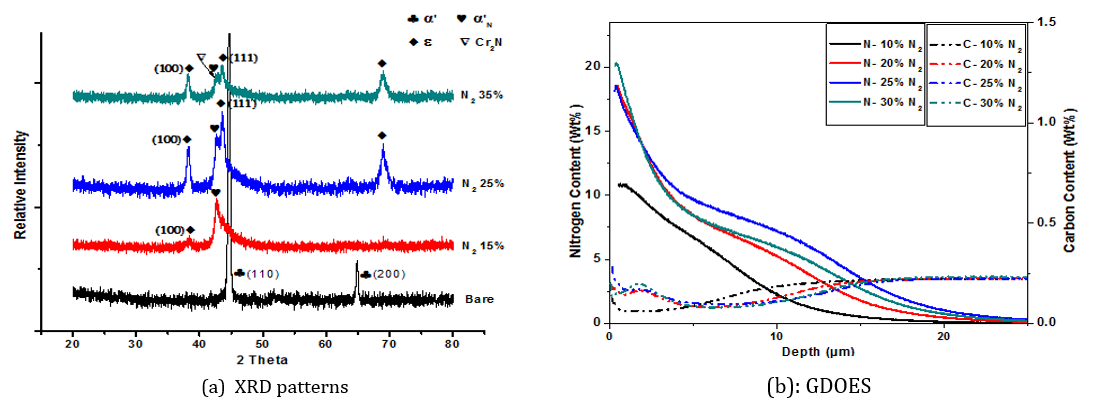
The XRD patterns of AISI 420 martensitic stainless steel samples nitrided at 400°C for 6 h with changing the nitrogen percentage from 10% to 35% are depicted in Figure 4(a). It also indicates that, the surface of the nitrided samples consists of mainly α'N and ε- Fe2-3N. The intensity of all the peaks are sharpest in 25% N2 treated sample. And at 35% N2 treated sample, the presence of Cr2N peak denotes that the corrosion resistance of this sample is poor. The broadening of all the peaks of 35% N2 treated sample indicates that some strain was built up due to overly supersaturated-nitrogen on the martensite matrix, which helps to the formation of chromium nitride as chromium has a strong affinity to nitrogen. Also the blunt and weak intensity of all the peaks indicate the occurrence of severe crystal deformation due to the presence of enough amount of supersaturated-nitrogen, which cause to increase the α'N layer. Therefore, further increase of nitrogen percentage will promote the formation of chromium nitride.
GDOES analysis exhibited in Figure 4(b), sample surface indicate the presence of higher nitrogen content (wt%), when nitrogen percentage in the nitriding chamber was increased from 10% to 30%. Thus higher concentration gradient of nitrogen enhance the diffusion depth of nitrogen through martensite matrix and aids the increment of α'N layer thickness.
Also, nitrogen goes deeper into the sample from the surface at 30% N2 treated sample. That means, nitrogen diffuses deeper into the bulk when nitrided with higher amount of nitrogen gas, with fixing the other parameters.
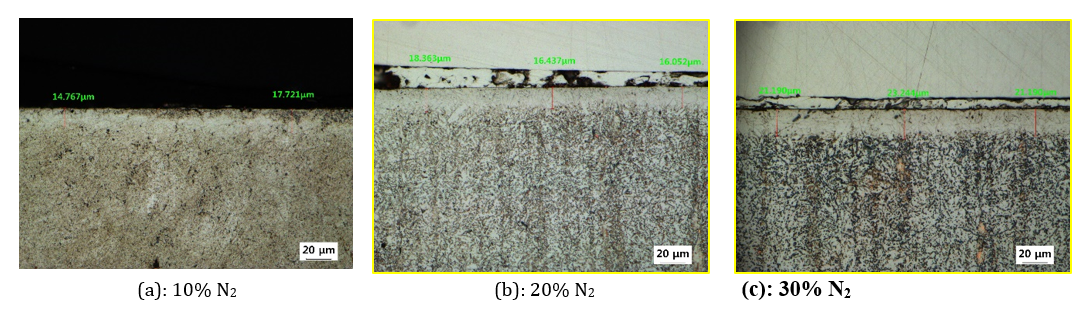
The α'N layer thickness increases with increasing nitrogen percentage (Figure 5). In the microstructure, the α'N layer of 10% N2 treated sample is comparatively cleaner than the 30% N2 treated sample, which means they have less Cr2N than the 30% N2 treated sample, in the α'N layer. However, the maximum thickness does not increase more than 22 µm where that is 33 µm for 15h treated one.
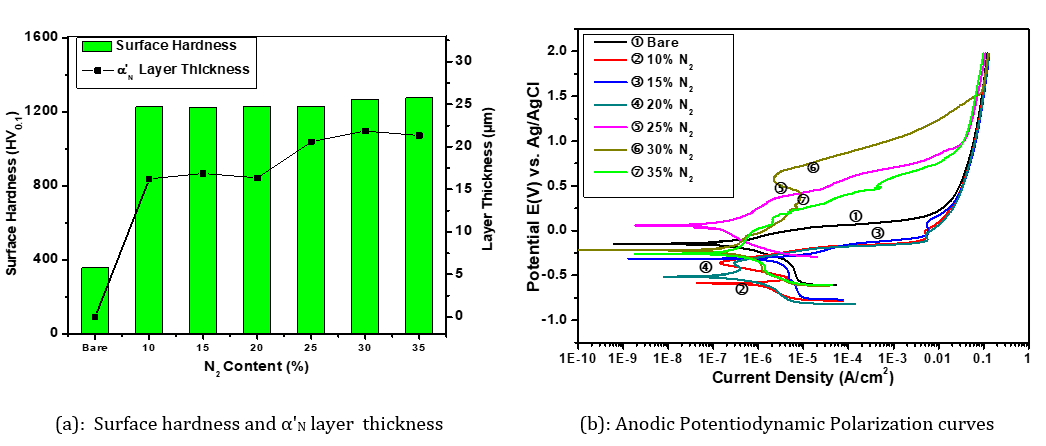
The surface hardness and α'N layer thickness comparison shown in Figure 6(a) show that the α'N layer thickness increases with increasing amount of nitrogen, though their surface hardness remains almost same (around 1230 HV0.1). The α'N layer thickness increases from about 16 µm to 22 µm when the nitrogen content increases from 10% to 35% respectively. Although their surface hardness values are quite constant, it has almost 4 times higher value than the bare one.
Figure 6 (b) represents the anodic potentiodynamic polarization curve of the AISI 420 samples treated with various nitrogen percentage. Introducing low amount of nitrogen has adverse effect on the corrosion resistance of AISI 420 nitrided samples. As can be seen from the polarization curve the Ecorr value decreased to about -587 mV for 10% N2 treated sample compared to that of bare (around -147 mV). Also the current density of 10% N2 treated sample increased to one order of magnitude, indicating higher corrosion rate. But more increase of nitrogen percentage shows the increase of corrosion resistance. Ecorr value increased to about 60 mV for 25% N2 treated sample, along with the decrease of current density closer to the bare sample. But there is no significant change in corrosion behavior for further increase of nitrogen percentage. Ecorr value of around -220 mV and -258 mV respectively of 30% and 35% N2 treated samples indicate nearly same corrosion resistance as the bare sample. Also their corrosion current density shows the same resemblance with the bare sample. Thus 25% N2 treated sample shows the best corrosion resistance among all the nitrided sample.
3. 3. Effect of CH4 Percentage
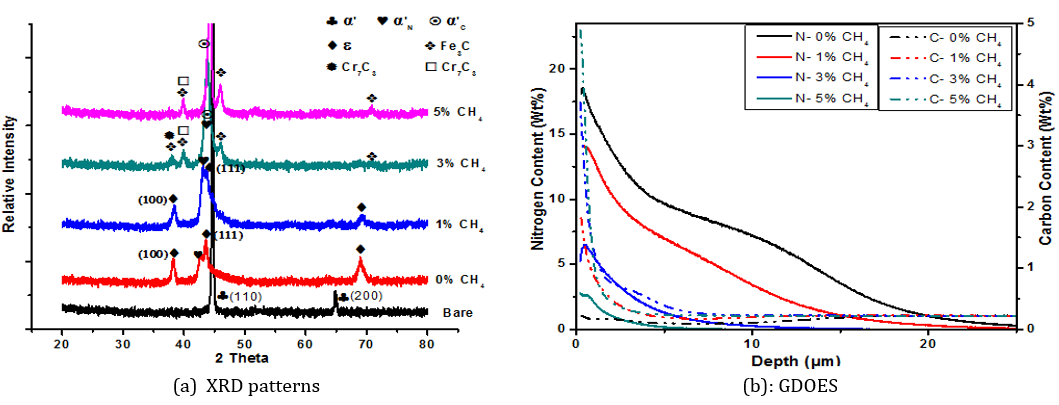
Figure 7(a) depicts the XRD patterns of AISI 420 samples nitrided for 6h, at 400°C with fixed 25% N2 and increasing the amount of CH4 from 0% to 5%. As the CH4 percentage increases, the 2θ values of α'N peak increases and their peak intensity also becoming stronger. This phenomena indicates that, the nitrogen supersaturated martensite lattice is recovering from their distorted form or a new layer is forming. As can be seen in 0% to 1% CH4 treated sample, the 2θ values of α'N peak increases to higher angle and peak intensity also increases.
The microstructure (Figure 8) and the GDOES analysis (Figure 7 (b)) also point out the decrease of α'N layer thickness with the increase of the amount of CH4. With further increment of CH4 percent to 3% and 5%, 2θ values of that peak moves to higher angle and its intensity also becomes stronger, which resembles with the α'C peak. So, with increasing the amount of CH4 the possibility of forming α'N layer decreases while the possibility of forming α'C layer increases. Also at higher CH4 percent, the presence of Cr23C6, Cr7C3 and Fe3C peak are found in the XRD analysis, which are very detrimental for their corrosion resistance.
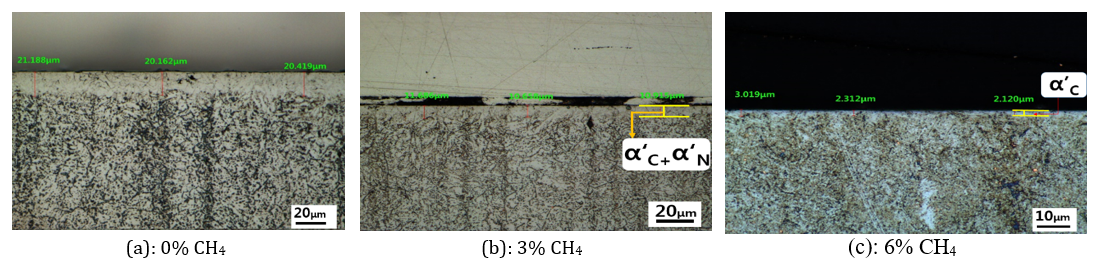
The cross sectional microstructures from Figure 8 show that the thickness of the α'N layer decreases with increasing the amount of CH4 percent. The α'N layer have decreased so much in 6% CH4 treated sample that it is very hard to identify the layer from the bulk matrix. And earlier in the XRD analysis (Figure 7(a)), the formation of α'C layer has been already confirmed for beyond 3% CH4 treated samples. But the thickness of α'C layer cannot be measured accurately as it is inseparable from the α'N layer.
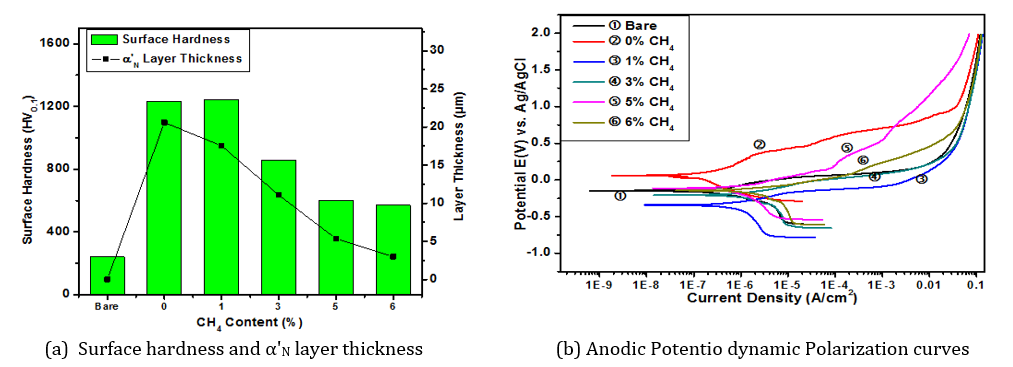
Moreover, the differences of surface hardness and hardened layer thickness of all the CH4 treated samples are compared in Figure 9(a). The surface hardness and hardened layer thickness have decreased with the increasing value of CH4 percent. Surface hardness decreased from around 1230 HV0.1 (0% CH4) to 620 HV0.1 (6% CH4). And hardened layer thickness values have decreased from about 22 µm (0% CH4) to 5 µm (6% CH4), which is supported by the GDOES analysis (Figure 7(b)).
The polarization curve of nitrided AISI 420 martensitic stainless steel with increasing amount of CH4 as represented in Figure 9(b). The CH4 treated samples shows poor corrosion resistance compared with that treated without CH4. The Ecorr value decreased to about -343 mV for 1% CH4 treated sample which is much lower compared to 60 mV of only nitrided (0% CH4) sample. This value is even worse than the bare one (-147 mV). Ecorr value and corrosion current density of 3%, 5% and 6% CH4 treated samples, indicate similar to worse corrosion behavior as the bare one. Thus, conclusions can be drawn that introduction of methane gas in nitriding atmosphere has no significant effect on the corrosion resistance of AISI 420 martensitic stainless steel.
4. Conclusions
The α'N layer behavior of plasma nitrided AISI 420 martensitic stainless steel with changing the gas content and treatment time of the nitriding process was investigated. This is significant because our main objective is to increase the corrosion resistance of AISI 420 martensitic stainless steel along with increasing the α'N layer thickness.
1. The α'N layer thickness values increases very rapidly with increasing processing time, while surface hardness remains almost same. On the other hand the corrosion resistance increases up to 6h treatment, after that the corrosion resistance becomes poorer.
2. With increasing nitrogen percentage α'N layer thickness values increases but not as much as increasing processing time, while surface hardness also remains same. Also their corrosion resistance values are as same as the bare one, except for the 25% treated one. It shows the best corrosion resistance among all the treated samples, even better than the bare one.
3. Introducing methane gas is not helpful for the nitrided samples. Increasing methane percentage, decreases the surface hardness and α'N layer thickness and also degrades their corrosion behavior.
Acknowledgement
This paper was supported by the Basic Research Program through the National Research Foundation of Korea funded by the Korean Ministry of Education (2017R1A2B1003729). This work was also supported by the Korea Basic Science Institute (KBSI) National Research Facilities & Equipment Center (NFEC) grant funded by the Korea government (Ministry of Education) (No.2019R1A6C1010045).
References
[1] I. Alphonsa, A. Chainani, P. M. Raole, B. Ganguli, P. I. John, “A study of martensitic stainless steel AISI 420 modified using plasma nitriding,” Surf. Coatings Technol., vol. 150, pp. 263–268. View Article
[2] C. Li, T. Bell, “Corrosion properties of active screen plasma nitrided 316 austenitic stainless steel,” Corros. Sci., vol. 46, pp. 1527–1547, 2004. View Article
[3] S. Kim, J. Yoo, J. Priest, M. Fewell, “Characteristics of martensitic stainless steel nitrided in a low-pressure RF plasma,” Surf. Coatings Technol., vol. 163-164, pp. 380–385, 2003. View Article
[4] A. D. Anjos, C. J. Scheuer, S. F. Brunatto, R. P. Cardoso, “Low-temperature plasma niytocarburizing of AISI 420 martensitic stainless steel:Microstructure and process kinetics,” Surf. Coatings Technol., vol. 275, pp. 51–57, 2015. View Article
[5] C. J. Scheuer, R. P. Cardoso, M. Mafra, S. F. Brunatto, “AISI 420 martensitic stainless steel low-temperature plasma assisted carburizing kinetics,” Surf. Coatings Technol., vol. 214, pp. 30–37, 2013. View Article
[6] C. J. Scheuer, R. P. Cardoso, F. I. Zanetti, T. Amaral, S. F. Brunatto, “Low-temperature plasma carburizing of AISI 420 martensitic stainless steel: Influence of gas mixture and gas flow rate,” Surf. Coatings Technol., vol. 206, pp. 5085–5090, 2012. View Article
[7] L. Mariano, S. Francisco, R. Perito, “Martensitic Stainless Steels Low-temperature Nitriding: Dependence of Substrate Composition 2,” Experimental Procedure, vol. 18, pp. 622–627, 2015. View Article