International Journal of Mining, Materials, and Metallurgical Engineering (IJMMME)
ISSN: 2562-4571

Volume 6 - Year 2020 - Pages 27-34
DOI: 10.11159.ijmmme.2020.003
Influence of Sn on practical performances of structural steels
Kazuki Inujima1, Kazutoshi Ichikawa1
1Graduate School of Environmental Studies, Tohoku University
468-1 Aramaki, Aoba, Sendai, Japan
kazuki.inujima.s5@dc.tohoku.ac.jp; kazutoshi.ichikawa.b6@tohoku.ac.jp
Abstract - The use of "recycled steel" to reduce environmental impacts is being considered by various organisations because such steel can contribute to a reduction in CO2 emissions compared with steel made of iron ores. In the case of "recycled steel", however, the concentration of impurities may increase if the steel is made of low-quality recycled materials; especially, it is difficult to remove some elements such as Cu and Sn from steels. These elements are called as “tramp elements”, and the concentrations of these elements in scrap have been found to increase recently. "Recycled steel" steels are often used as structural steels (i.e., for construction purposes). Thus, recycled steel should exhibit good strength, toughness and weldability. Sn is particularly well known as a detrimental element for structural steels. Therefore, it is important to identify the influence of Sn on mechanical properties of structural steels. Mechanical properties, such as strength, ductility and Charpy toughness, were then examined in the directions of length and width for all the plates with different Sn concentrations, which were subjected to laboratory-casting. Furthermore, characteristics of thickness direction were also investigated to evaluate the lamellar tear susceptibility, which is a weld flaw. Microstructures and ferrite matrix hardness were measured and investigated to discuss the influence and mechanisms of Sn on the mechanical properties of steels. As a result, the yield, tensile strength, and absorbed energy at 20°C were decreased, and the fracture appearance ductile to brittle transformation temperature (FATT) was increased with increasing Sn content. Toughness (FATT and absorbed energy) in the thickness direction was particularly deteriorated by Sn. It can be assumed that according to the tensile and hardness test results, strengthening and deterioration in toughness by Sn are due to solid-solution strengthening.
Keywords: Recycled steel, mechanical properties, thickness direction, tin, environmental impacts.
© Copyright 2020 Authors This is an Open Access article published under the Creative Commons Attribution License terms. Unrestricted use, distribution, and reproduction in any medium are permitted, provided the original work is properly cited.
Date Received: 2019-12-12
Date Accepted: 2020-02-14
Date Published: 2020-03-25
1. Introduction
Steel is practically the only material in which "closed-loop-recycle" can be applied. "Closed-loop-recycle" can be defined as an infinite and versatile recycling system which can reproduce various new products from scrap [1]. One of the reasons that steel is a closed-loop-recycle material is that tramp elements in steels can be managed fairly easily, compared with those in other metals. ”Tramp elements” are defined as elements whose removal is difficult by refining processes. Closed-loop recycling can lead to more sustainability than the so-called "open-loop-recycle system" by reducing the consumption of natural resources. This system thus plays an important role in “responsible consumption” as one of sustainable development goals (SDGs) defined by the United Nations [2]. Electric furnace steelmaking has been falsely termed as “recycled steel” because of the belief that it is more environmentally friendly. The primary reason for this is that the conversion from iron ore to crude iron in a blast furnace leads to more than 70% of carbon dioxide emissions in Japan; this was observed in 2004 [3]. The Tokyo metropolitan government has considered further use of "recycled steel" for public construction [4]. Some other countries have also considered a similar policy [5]. The expansions in the use of "recycle steel" have to be carefully verified in the view of materials science and structural safety.
Steel (particularly "recycled" steel) contains Cu, Ni, Mo, and Sn as “tramp elements”. The detrimental effects of a small increase in the Cu content for steel mechanical properties are low; Ni and Mo may be rather beneficial because they sometimes improve the strength and toughness of steel. Meanwhile, more than 0.04% and 0.2% of Sn contents deteriorate on hot and cold workability respectively [8]. Sn is also reported to be detrimental for the mechanical properties such as strength and toughness of steel [6], [7]. Moreover, a fact that necessitates immediate attention is that the Sn and Cu contents in scraps of iron sources have been reported to gradually increase [9]. "Recycled steel" is often used for building structures in Japan [10]. This steel should exhibit sufficient strength, ductility, and toughness because Japan faces many disasters such as earthquakes. Therefore, it is important to identify the influence of changing concentrations of Sn on mechanical properties of structural steel.
Table 1: Chemical compositions of each steel (mass%).
| Code | C | Si | Mn | S | P | Cr | Ni | Cu | Al | Sn | N | O |
| SN1 | 0.15 | 0.28 | 1.20 | 0.0030 | 0.015 | 0.096 | 0.097 | 0.18 | 0.020 | <0.0003 | 0.0102 | 0.0014 |
| SN2 | 0.15 | 0.30 | 1.22 | 0.0029 | 0.016 | 0.097 | 0.099 | 0.18 | 0.021 | 0.019 | 0.0097 | 0.0014 |
| SN3 | 0.15 | 0.30 | 1.19 | 0.0031 | 0.015 | 0.097 | 0.099 | 0.19 | 0.020 | 0.050 | 0.0101 | 0.0016 |
| SN4 | 0.16 | 0.29 | 1.17 | 0.0030 | 0.015 | 0.097 | 0.098 | 0.19 | 0.019 | 0.100 | 0.0104 | 0.0016 |
| SN5 | 0.16 | 0.30 | 1.20 | 0.0032 | 0.014 | 0.100 | 0.100 | 0.21 | 0.020 | 0.300 | 0.0103 | 0.0018 |
V<0.003, Nb<0.003, Mo<0.003, Ti<0.002, B<0.0003, Zn<0.002.
In this study, the influence of Sn on practical performances of structural steels was investigated. The practical performance with respect to mechanical properties, such as strength and toughness in various directions and locations in the plate, were studied. To estimate the influences on lamellar tear of welding, characteristics of the thickness direction were measured in each case. The strengthening mechanism was discussed according to the microstructures and microhardness.
2. Experimental Procedures
2. 1. Base materials
Five steel ingots were casted in a 300-kg vacuum furnace (FM1-2-300S, Nihon Shinku Gijyutsu). Their chemical compositions are shown in Table 1. These ingots, with a nominal thickness of 265 mm, were reheated at 1200℃, rolled into 75-mm-thick plates by 14 rolling passes and were water cooled. Water cooling started at approximately 830℃ and ended at approximately 550℃.
2. 2. Mechanical tests
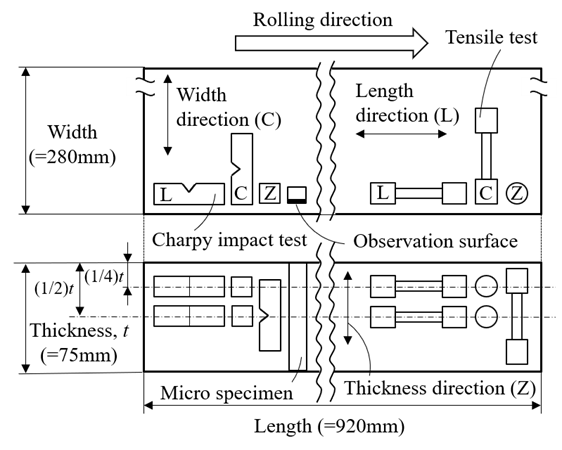
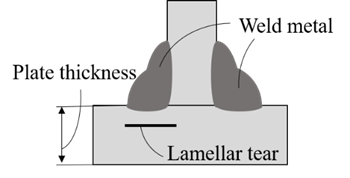
All steel samples were provided for tensile test and Charpy impact tests. Sampling locations and directions are shown in Figure 1. Two samples for tensile tests and 75 for Charpy impact tests were machined for each location and direction. Directions are defined as "L", "C" and "Z", which denote length, width, and thickness directions, respectively, as shown in Figure 1. Sampling locations were (1/2)t and (1/4)t, where t is the plate thickness. In this study, the thickness direction was particularly considered to evaluate the influence of Sn on lamellar tear susceptibility, one of the flaws of welding, which may occur in heavy sections of plate welds, as shown in Figure 2. In this case, the rolling direction is along the length direction. The specimen details for tensile tests are as follows: 32 mm gauge length and 6 mm diameter with 70 mm specimen length. UH-F500kN-A, Shimadzu Corporation was used for the tensile tests. A 2 mm depth V-notched Charpy impact test was performed under five temperatures, the common temperature of 20 ℃ and four other temperatures chosen from the range of 0 to 80℃ with 3 repetitions for each temperatur e CI-600D, Maekawa Testing Machine MFG. Co., LTD. was used for the Charpy impact tests. Crystallinities (proportion of the brittle fracture surface) were measured to determine the fracture appearance ductile to brittle transformation temperatures (FATTs) along with the absorbed energy of each Charpy impact specimen.
2. 3. Microstructure observation and micro-Vickers tests
Through-thickness (75-mm) samples for microstructure observations were collected from each steel plate along the observation plane (longitudinal vertical plane to the rolling direction), as shown in Figure 1. Microstructure observation positions include (1/4)t and (1/2)t with an etching agent of 2% Nital. All microstructure samples were also subjected to micro-Vickers tests to evaluate the hardness of the ferrite grain matrix without grain boundary effects, which cannot be identified by tensile tests or ordinary Vickers hardness tests. The test load was 10 gf with a keeping time of 12 seconds. ECLIPSE LV150N, Nikon Corporation was used for the microstructure observations. 10 ferrite grains were selected at around (1/2)t to measure 1 spot for each grain. AAV-502, Mitsutoyo Co., LTD was used for micro-Vickers hardness tests. Furthermore, to investigate the constitutions of various microstructures in steels, metallographic tests were also performed. The "Point counting technique"[11] was adopted, where 100 points of the microstructures were determined visually on the optical micrographs taken at a magnification of 200.
3. Results and Discussions
3. 1. Strength
Figure 3 and Figure 4 show the effects of Sn on proof and tensile strength, respectively. Both proof and tensile strengths in (1/4)t were higher than those in (1/2)t in both L (longitudinal) and C (width) directions. The tensile properties in the Z (plate-thickness) direction show a similar tendency to those in the longitudinal (L) and width (C) directions at the thickness centre (i.e., (1/2)t). These results are caused by the gauge length region of the Z direction tensile specimen being located in the thickness centre. It can be assumed that the difference in the strength between (1/2)t and (1/4)t was caused by the difference in cooling performance; i.e., cooling rate shall be higher at (1/4)t than that at (1/2)t, particularly for heavy section materials applied in this study. This is because the thermal conduction at (1/4)t is larger due to the surface heat transfer. It should be mentioned that the strengths do not depend on specimen direction (L, C, and Z) to a large extent but do depend on the sampling location in the thickness direction in the present study.
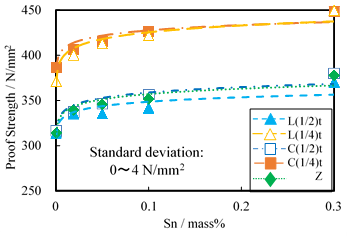
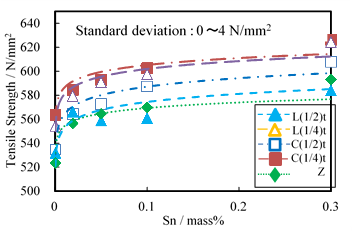
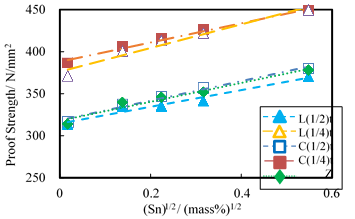
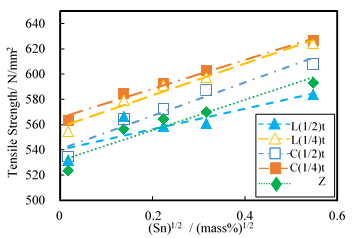
Notably, Figure 3 and Figure 4 show that the initial increase in proof and tensile strength is steep, whereas the subsequent increase is moderate. It is therefore assumed that these are reasonably approximated by a parabolic function. Proof and tensile strength are then plotted as a function of square root of Sn concentration in Figure 5 and Figure 6, respectively. The figures demonstrate that the square root of Sn concentration and the strengths have a linear relationship. This will be discussed in detail later using the micro-Vickers hardness results.
3. 2. Charpy impact toughness
Figure 7 shows the influence of Sn concentration on FATT. FATT increases with Sn concentration in all directions and locations and their relationship can be roughly approximated by the parabolic lines. For all directions and locations, except for the thickness direction, they demonstrated almost fairly similar movements of the values of FATT against Sn concentration. FATT in the thickness direction is, however, inferior to that in any other directions and locations. Figure 8 shows the relationship between absorbed energy and Sn concentration at 20℃. Like FATT, the absorbed energy increases with Sn concentration in all directions and locations, and their relationship can be roughly approximated by the parabolic lines. For all directions and locations, except for the thickness direction, they demonstrated almost fairly similar tendencies of absorbed energy as a function of Sn concentration. Toughness factors such as FATT and absorbed energy, obtained by the Charpy impact test, can be often related with strength. The relationship between tensile strength and FATT is shown in Figure 9. FATT values shown in Figure 7 can be represented as a function of tensile strength. Therefore, it can be assumed that toughness (e.g., FATT and absorbed energy) also have a parabolic relationship with Sn concentration, which is similar to proof and tensile strength, because toughness shows a linear relationship with strength.
As seen below, FATT, can be represented as a function of strength to be characterized as a toughness factor. However, because FATT values were deduced by several measurements of the fracture surfaces, they may comprise larger intrinsic errors than that observed when the definite absorbed energy is considered as the alternative toughness factor. It is thus more evident in the parabolic relationship between Sn concentration and toughness demonstrated by absorbed energy as shown in Fig. 8. Figure 10 shows the relationship between absorbed energy and tensile strength.
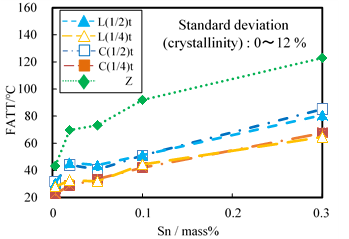
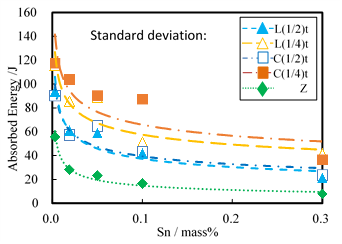
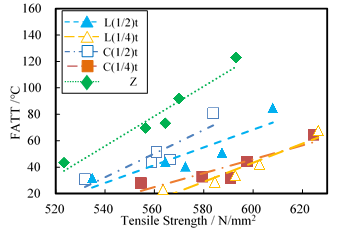
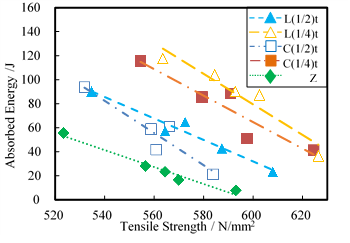
Figure 8 and Figure 10 indicate that the absorbed energy values can also be represented as functions of tensile strength. In addition, the absorbed energy in the thickness direction is particularly inferior to that in any other directions and locations. Therefore, Sn causes a detrimental influence on both FATT and absorbed energy. In particular, this trend is prominent in the thickness direction of the Charpy test specimen. Thus, even slight concentrations of Sn may negatively affect lamellar tear of welding in heavy section plates.
3. 3. Strengthening mechanisms
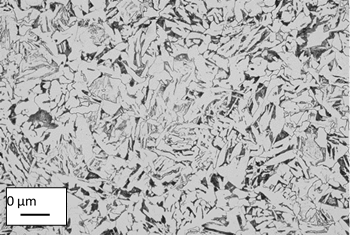
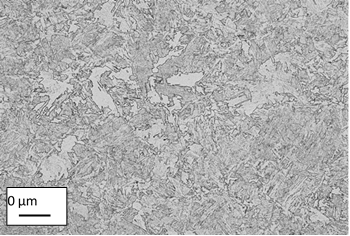
Figure 11 and Figure 12 shows the microstructures at (1/2)t and at the surface of SN1, respectively. The steel at (1/2)t contains larger grains of ferrite with minor amounts of pearlite, bainite, and Widmanstätten ferrite, whereas the one at the surface contains mainly bainite. This difference in the microstructures causes higher tensile and proof strengths in the longitudinal and width directions at (1/4)t than those in the same directions at (1/2)t, (and Z directions as well), as demonstrated in Section 3.1. As seen in Figure 5 and Figure 6, the strength in all directions and locations exhibits a parabolic relationship with Sn concentration. This result suggests that the strengthening mechanism may be explained by solid-solution strengthening because such a mechanism is well known to be represented by Equation (1) [12].

where ![]() is the yield strength, M is
Taylor factor,
is the yield strength, M is
Taylor factor, ![]() is
the interaction parameter (0<α<1) between the matrix and
solution atoms as a function of the difference in the atomic radii and the
“distance” in the periodic table, G is the shear modulus, and c
is alloy concentration. This equation can be simplified to the expression of
Equation (2), where k is a constant independent of c.
is
the interaction parameter (0<α<1) between the matrix and
solution atoms as a function of the difference in the atomic radii and the
“distance” in the periodic table, G is the shear modulus, and c
is alloy concentration. This equation can be simplified to the expression of
Equation (2), where k is a constant independent of c.

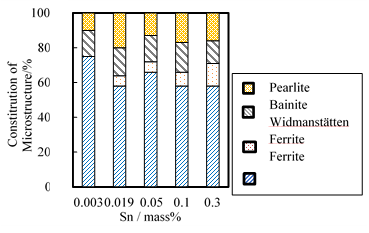
The results of the point counting are shown in Figure 13. Considering the nature of the quantitative technique of this microstructural experiment, there seems to be no significant difference in the constitution of the microstructure, except that the presence of Widmanstätten ferrite was not observed in 0.003% SN1. These minor differences in the microstructure shown in Figure 13 cannot explain the increase in strength shown in Figure 3 and Figure 4. It can thus be assumed that the microstructural change by Sn is not a major factor controlling strength.
Next, to observe the mechanism of the increase in strength by Sn in the steels, Figure 14 shows the relationship between average micro-Vickers hardness of 10 ferrite grain matrices and Sn concentration, where the error bars are lined between maximum and minimum values. The microhardness of the ferrite matrix exhibits a roughly parabolic relationship, taken errors into account, with Sn concentration, which is similar to the relationship of strength with Sn concentration represented in Figure 3 and Figure 4. According to these experimental results, the major strengthening mechanism by Sn was determined to be solid-solution strengthening by Sn itself or precipitation strengthening by intermetallic compounds of Sn. This is a useful and important assumption because it suggests that the detrimental influence of Sn on mechanical properties can be minimised by reducing the strength by decreasing the concentrations of other alloy elements such as Mn. An important unsolved issue raised in this study is the mechanism of the prominent deterioration of the toughness in the Z direction (thickness direction) with Sn concentration. It should be noted however that grain boundary embrittlement by Sn has to be investigated carefully to discuss the effect of Sn on toughness. Furthermore, careful investigations on the microstructural and crystallographic anisotropies are needed.

4. Conclusions
In the present study, we studied the influence of Sn, as a tramp element in heavy section steel, on the mechanical properties. The results showed that Sn (up to 0.300 mass%) causes some detrimental effects on practical performance of structural steel. The following conclusions were drawn:
(1) Proof and tensile strength are increased with increasing Sn concentration in all directions, including the plate longitudinal, width, and thickness directions. These strengths have parabolic relationships with Sn concentration.
(2)Toughness, represented by FATT and Charpy absorbed energy values, was deteriorated by an increase in Sn concentration. It is positively correlated with strength. Thus, we assumed that toughness also has a parabolic relationship with Sn concentration. In addition, the toughness in the thickness direction is particularly inferior to those in other directions (plate longitudinal and width directions).
(3)According to the above and micro-Vickers hardness test results, it is assumed that the major strengthening mechanism by Sn in this study is solid-solution strengthening by Sn itself or precipitation strengthening by intermetallic compounds of Sn.
As mentioned in above (2), Sn, which may come from scrap, in heavy section structural steels may seriously affect the safety of structures through lamellar tear during welding and through toughness deterioration. Therefore, it is important to consider the increase in Sn concentrations of structural steel while designing structures.
References
[1] T. Isohara: Life Cycle Assessment in Steel product, Future Measures against Global Warming in Steel Industry (NMS-ISIJ), 233-234, 2018.
[2] United Nations. Sustainable Development Goals. [Online]. Available: https://www.un.org/sustainabledevelopment/sustainable-development-goals/ View Article
[3] T. Ariyama, R. Murai, J. Ishii and M. Sato, “Reduction of CO2 Emissions from Integrated Steel Works and Its Subjects for a Future Study,” ISIJ Int., vol. 45, pp. 1371, 2005.View Article
[4] Tokyo metropolitan government, Tokyo metropolitan government procurement policies for environmental articles in fiscal year of 2007 (in Japanese) [Online]. Available: http://www.toshiseibi.metro.tokyo.jp/seisaku/recy/pdf/recy_29-1.pdf View Article
[5] Mitsubishi Research Institute, Investigations on future advancement of electric furnace steel industry in 2011, (in Japanese) [Online]. Available: www.bpfj.jp/act/download_file/78638529/18603727.pdf View Article
[6] B. Liu and Y. F. Zheng, “Effects of alloying elements (Mn, Co, Al, W, Sn, B, C and S) on biodegradability and in vitro biocompatibility of pure iron,” Acta Biomaterialia., vol. 7, pp. 1407-1420, 2011. View Article
[7] S. Shenghua, X. Yewei, C. Xianmiao and J. Xue, “Effect of rare earth cerium and impurity tin on the hot ductility of a Cr-Mo low alloy steel,” Journal of rare earths, vol. 34, no. 10, pp. 1062-1068, 2016.View Article
[8] H. Katayama and Y. Mizukami, “Recycling of Ferros Scrap,” Bulletin of the Japan Institute of Metals MateriaJapan., vol. 35, pp. 1283-1289, 1996. View Article
[9] Tokyo Steel, Report of investigations on extensive utilisation of steel scrap in fiscal year 2013 (in Japanese) [Online]. Available: http://www.env.go.jp/recycle/car/pdfs/h25_report05_mat01.pdf View Article
[10] H. Furuya, R. Uemori, S. Aihara, Y. Tomita, T. Ikebe, T. Kojima, H. Okamoto, T. Kubo, R. Ando, K. Higuchi, A. Mukai and K. Morita, “Effect of Chemical Compositions of the HAZ Toughness and Its Formulation under Simulated Column-Beam Connection Welding of Structual Steel for Building,” Steel Construction Engineering, vol. 8, pp. 17-31, 2001.
[11] Anon.: Guide to the light microscope examination of ferritic steel weld metals, Weld. In the world, vol. 29, 160-176
[12] K. Maruyama, M. Fujiwara and K. Yoshimi, Kouzou Kinzoku Zairyou Gaku. Uchidarokakuho publishing co., ltd, 2014.