International Journal of Mining, Materials, and Metallurgical Engineering (IJMMME)
ISSN: 2562-4571

Volume 7 - Year 2021 - Pages 1-15
DOI: 10.11159.ijmmme.21.001
Design Fire Scenarios Involving Non-Fire Resistant Conveyor Belts – Numerical Study
Rickard Hansen
The University of Queensland, Sustainable Minerals Institute
Brisbane QLD 4072, Australia
rickard.hansen@uq.edu.au
Abstract - A fire in a non-fire resistant conveyor belt may present a severe risk with a long-lasting fire with higher heat release rates. What impact would influencing parameters have on a conveyor belt fire and what would design fire scenarios with conveyor belts look like? An ignition model was set up, and data from conducted fire experiments were used to numerically investigate the impact of influencing parameters and presenting design fire scenarios. All scenarios indicated a fire starting with a fast growing acceleration phase, transitioning to a steady-state phase. The steady-state phase occurred as the buoyancy force of the fire increased, decreasing the flame tilt angle. With an increasing ignition source, the heat release rate during the latter part of the acceleration phase was found to increase as well. A decreasing belt width resulted in an increased flame spread velocity. A decreasing belt thickness had no effect on the flame spread velocity but instead led to a lower heat release rate. With decreasing conveyor drift dimensions, the flame length increased, resulting in a slower flame spread rate and lower heat release rate. If flame deflection occurred, a fire behaviour resulted where the flames along the roof led to higher flame radiation levels at longer distances from the fire, increasing flame spread velocity and heat release rate. Developed design fire scenarios could improve the fire safety in conveyor drifts and the safety for the personnel underground.
Keywords: Design fire, Conveyor belt, Underground mine, Heat release rate, Flame spread.
© Copyright 2021 Authors This is an Open Access article published under the Creative Commons Attribution License terms. Unrestricted use, distribution, and reproduction in any medium are permitted, provided the original work is properly cited.
Date Received: 2019-08-23
Date Accepted: 2020-12-15
Date Published: 2020-XX-XX
1. Introduction
A conveyor belt fire – involving a non-fire resistant conveyor belt - in an underground non-coal mine will pose a severe risk due to a potentially long-lasting fire with higher heat release rates and extensive smoke production as well as smoke spread, endangering the mine personnel. The fire will be different in characteristics compared with other fires in underground non-coal mines, as the non-fire resistant conveyor belt will present a continuous fire load over potentially a considerable distance. The fire may therefore be characterized as a line fire, spreading continuously along the belt surface in the direction of the ventilation flow and where the combustion zone travels along the fuel surface accordingly. When considering the fire safety along a conveyor drift in an underground non-coal mine, the design fire methodology will be an important tool given the complexity of the mine surroundings, the influencing ventilation flow and the impact of other influencing parameters.
Several studies have been conducted on the flame spread velocity along the conveyor belt surface but few studies on the heat release rates of non-fire resistant conveyor belts and corresponding design fire scenarios. This paper remedies this lack of knowledge by numerically investigating the impact of influencing parameters on the heat release rate and presenting design fire scenarios involving conveyor belts.
Nakagawa et al. [1] conducted laboratory-scale gallery fire tests on different rubber conveyor belts, where one of the conveyor belts was of a non-fire resistant type. The study resulted in measured flame spread velocities and ignition times for a horizontal case as well as an inclined case. The dimensions of the gallery was 2.5 m long, 0.35 m wide and 0.35 m high. The belt specimen were 60 mm and 90 mm wide and approximately 1.5 m in length.
Hwang et al. [2] set up a model to calculate the flame spread along conveyor belts, applying the flame radiation as the main and sole fire spread mechanism. Several existing correlations on flame tilt, flame length, etc. were applied in the model. It was found that with interaction of the air speed and the source fire, the length of the burning zone following ignition has a maximum in the vicinity of 1.5 m·s-1 air speed. The results of experiments reported in the paper were based on a fire resistant belt.
Wachowicz [3] conducted full-scale fire experiments on 42 m long and 0.5 m wide fire resistant conveyor belts and presented calculations of the resulting heat release rates. The maximum heat release rate of the resulting curves was approximately 7 MW (also including the heat release rate of the 300 kg wood used as ignition source) and the maximum heat release rate of the burning wood was approximately 3.5 MW. The duration of the fires (until the heat release rate dropped below 1 MW) was generally approximately 30 minutes. The longitudinal ventilation velocity was 1.2 m·s-1 during the experiments.
Green and Fletcher [4] developed design fire scenarios for conveyor belt fires and applied the results in ensuing CFD modelling. Applying data from cone calorimeter experiments, the peak heat release rate of the non-fire resistant scenario was set to 1.0 MW and the fire growth was assumed to follow a t2 curve attaining the peak value after 300 s. The modelled region was 0.9 m wide, 3 m along the belt and 0.4 m high.
Wachowicz [5] performed cone calorimeter experiments on textile-reinforced fire-resistant, chloroprene conveyor belts. The measured parameters included the energy released, time to ignition, mass loss rate, heat release rate and effective heat of combustion.
Yuan and Litton [6] presented experimental results from conveyor belt tests conducted in a small-scale tunnel, investigating the effects of belt type, ventilation velocity, belt surface-to-roof distance and ignition source power on the flame spread properties. The dimensions of the tunnel was 4.9 m long by 0.46 m square, the belt specimen measured 0.23 m wide and 2.5 m long and the longitudinal ventilation velocity ranged from 0.7 to 3.2 m·s-1. The heat release rate of the ignition source ranged from 7 to 21 kW. Three different belt-to-roof distances were applied in the experiments: 0.34, 0.22, and 0.11 m respectively. The belts tested included non-fire resistant rubber belts. It was found that with a belt surface-to-roof distance of 0.11 m, the flame spread rate initially increased but eventually decreased with an increasing ventilation velocity. A maximum flame spread rate occurred with a ventilation velocity of approximately 2.1 m·s-1. With a belt surface-to-roof distance of 0.22 m, the flame spread rate decreased with an increasing ventilation velocity, and the flame spread ceased for a ventilation velocity larger than 1.52 m·s-1. It was also found that for the non-fire resistant belts, the higher heat release rate of the ignition source the higher flame spread rate. The flame spread velocities were found to be almost identical for belts with different thicknesses with an ignition source of 14 kW.
Rowland and Smith [7] conducted experiments on 11 m long, wider conveyor belts to determine their flammability. Two tests were conducted on a non-fire resistant type and of styrene butadiene rubber and resulted in peak heat release rates of 10 and 11 MW respectively. The non-fire resistant belt was more or less instantaneously ignited along its full length. Thus, no flame spread velocities were obtained.
Alvares et al. [8] performed a study on the flammability characteristics of non-fire resistant light-duty conveyor belts and presented output data on ignition temperatures with and without a pilot ignition source, peak heat release rate and critical irradiance for ignition. The test results confirm that the incident heat flux dictates the heat release rate of the burning conveyor belt.
Given the complexity and the large number of influencing parameters, several design fire scenarios should be developed, potentially covering several different cases or points of interest. The purpose of this study was to numerically investigate the impact of influencing parameters and to present several, potential design fire scenarios involving non-fire resistant conveyor belts in underground non-coal mines. The design fire scenarios were developed applying data from conducted fire experiments and setting up a model to calculate the fire spread and heat release rate along the fuel surface. The resulting design fire scenarios were compared with the results of earlier fire experiments. The proposed design fire scenarios would improve the fire safety of the conveyor drift as well as other, adjacent parts of a mine and increase the safety for the personnel underground.
2. Design Fire Scenarios and Fires in Conveyor Belts
2.1 Design Fire Scenarios in the Mining Industry
A design fire scenario describes and quantifies parameters that are crucial when analysing the impact of the fire on the surroundings. During the analysis, the fire protection measures are weighed against the risk to personnel and operations caused by the design fire scenario. Crucial parameters could for example be the heat release rate, ventilation conditions, room geometry, etc. The design fire methodology is a common methodology and has been used extensively throughout the years when analytically evaluating the fire safety in buildings, tunnels, etc. [9-10]. The corresponding studies on design fires in underground mines are very limited and have mainly been aimed at mining vehicles. Hansen [11] performed an initial study on design fire scenarios in underground mines, presenting and discussing several potential scenarios. Hansen [12] elaborated further on the design fire methodology in a separate study, presenting design fire scenarios representative for Australian mines. The presented scenarios contained only fires in mining vehicles.
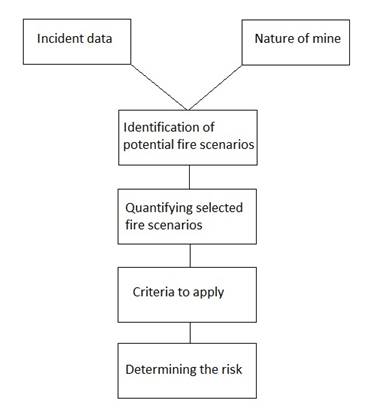
The design fire methodology includes several different steps; figure 1 displays an overall flow chart of the process. The first step encompasses the gathering of data with respect to the mine layout, equipment used, and characteristics of the mine as well as incident data. The first step aims at identifying potential fire scenarios based on the collected data. The following step includes the quantification and further specification of the design fire scenarios. Quantified or specified parameters could for example include the position of the fire, the heat release rate, the fire growth rate, the ventilation flow at the site of the fire, any sensitive installations nearby, types and amounts of fuel involved, etc. The final steps will include the decision on what criteria to apply when evaluating the results from the scenarios and the evaluation of the developed scenarios.
The steps included in this study were limited to the identification of potential fire scenarios and the quantification and specification of the selected design fire scenarios. Thus, the specific risk to mining personnel and sensitive surroundings were not determined applying the resultant fire behaviour from the quantification.
2.2 Fires in Conveyor Belts
Along a conveyor belt, one will find a large amount of combustible materials including the conveyor belt, rollers, grease and oil. The continuous distribution of the combustible material along the conveyor drift and the longitudinal ventilation flow assisting the flame spread will pose a challenge to any fire protection system and the fire safety of the mine. Fires in non-fire resistant conveyor belts will generally result in higher heat release rates, higher fire growth rate and a more rapid flame spread velocity compared with a fire in a fire-resistant conveyor belt.
Standards specifying fire safety demands on conveyor belts in mines are focused on coal mines. For example NFPA 120 [13] states that underground conveyor belts in coal mines shall be of flame-resistant material and that fire suppression systems shall be installed at main and secondary belt conveyor drive areas.
NFPA 122 [14] for metal and non-metal mines, states that a fire risk assessment shall be used to determine protection requirements of conveyor belts.
The Mines Safety and Inspection Regulation 1995 [15] of Western Australia states that it must be ensured that conveyor belts in an underground coal mine are constructed of flame-resistant material. The Health and Safety (Mines and Petroleum Sites) Regulation 2014 [16] of New South Wales states that conveyor belting and conveyor accessories used at an underground coal mine or in a reclaim tunnel at a coal mine shall be of fire resistant anti-static material.
The Coal Mining Safety and Health Regulation 2017 [17] of Queensland states that at an underground coal mine it must be ensured that each conveyor belting and drum lagging is fire resistant and anti-static.
No specific fire requirements on conveyor belts in non-coal mines are listed for Western Australia, New South Wales and Queensland.
Given that a conveyor belt in a coal mine will transport a combustible product – adding considerably to the fuel load – the focus on fire safety measures on conveyor belts in coal mines is understandable. Still, the fire risks with a conveyor belt in a non-coal mine cannot be disregarded given the fire behaviour of non-fire resistant conveyor belts.
In NFPA 122 [14] the following ignition sources for fires in conveyor belts are listed: friction points, hot bearings, tracking, frame damage, electrical, combustible storage, hot work and spontaneous combustion of spilled fuels. In a study on underground coal mine conveyor belt entry fires [18], it was found that a majority of the fires was caused by friction at the belt drive or along the belt.
In a report by Hansen [19] it was found that following upon vehicle fires, fires in conveyor belts were generally found among the most common types of fires in the Australian mining industry. The most common causes of conveyor belt fires in Western Australia (encompassing the time period of July 2014 until July 2017) were the following:
- Failed bearing causing ignition of excess grease on the bearing.
- Failed roller or idler causing friction and igniting the roller.
- Idler or shredded rubber.
- Friction between the conveyor and a roller or a pulley.
- Metal in contact with the belt.
- Rocks wedged against a conveyor roller/belt causing friction.
- Hot briquettes or charcoal igniting the belt.
The most common fire locations: conveyor belt, belt roller, return roller, impact roller, idler, bend pulley and head pulley.
In a few cases did the fire in the start object spread further to nine rubber lagged impact rollers and two rubber skirts and in an another case did the fire involve approximately 2.5 m of conveyor belt.
2.3 Design Fire Scenarios – Conveyor Belts
Hansen [12] identified the following fire behaviours in underground hard rock mines, posing severe risks during all stages of the fire and affecting large parts of the mine:
- A fire with a rapid fire growth rate at an early stage of the fire, affecting the primary evacuation route/s.
- A fire with extensive smoke production over a long time period.
- An extensive or fast growing fire near an area with a large number of personnel.
- A fire with continuous fire spread, resulting in a long lasting fire with a high heat release rate.
- A fire where the smoke control system fails to function, leading to extensive smoke spread.
- A fire that goes undetected for a long time period, resulting in a considerable fire growth and heat release rate.
- A fire with longer and intermittent periods with high heat release rates and with sudden increases of heat release rates. The fire may cause problems during the smoke extraction and the rescue operation.
- 924 kW·m-2 for an incident heat flux of 60 kW·m -2.
- 681 kW·m-2 for an incident heat flux of 45 kW·m -2.
- 502 kW·m-2 for an incident heat flux of 30 kW·m -2.
- Average heat of combustion: 36 100 kJ·kg-1 [6].
- Density: 980 kg·m-3 [21].
- Specific heat: 1830 J·kg-1·K-1 [21].
- Thermal conductivity: 0.22 W·m-1·K-1 [21].
A fire in a conveyor belt will most certainly be qualified as a fire with continuous fire spread, resulting in a long lasting fire with a high heat release rate. Bearing these fire behaviours in mind, the following quantified parameters were included in the study: heat release rate, fire growth rate and flame spread velocity. The heat release rate will be valuable when for example determining the smoke production from the fire. The fire growth rate and the flame spread velocity will be assets when for example analysing the egress safety for the mining personnel.
The following input parameters were specified prior to the modelling of the fire spread along the conveyor belt: dimensions of the mine drift, distance between conveyor belt and roof, conveyor belt width, conveyor belt thickness, longitudinal ventilation velocity, position, size and heat release rate of ignition source.
The developed design fire scenarios in this study should be regarded as an investigative set of scenarios and should be supplemented or corrected by characteristics specific for the mine in question.
2.3.1 Ignition Source
The position of the ignition source will influence the early fire behaviour. An ignition source with a high heat release rate may lead to a rapid fire growth at an early stage of the fire.
An ignition source position at the very beginning of the conveyor belt is assumed in all scenarios, with a longitudinal ventilation flow pushing the flames along the entire length of the belt.
Given the listed ignition sources in chapter 2.2, a fire caused by friction would be statistically justified. A failed roller is assumed, causing friction and igniting the roller. The conveyor belt stops and the burning roller ignites the belt. The surface size of the initially ignited conveyor belt is assumed to be along the full width and 0.15 m in length (the diameter of the roller).
Using the measured heat release rate of 502 kW·m-2 (the peak heat release rate at an incident heat flux of 30 kW·m-2) from Alvares et al. [8], results in a heat release rate of 135.5 kW for the 0.27 m2 case. The heat release rate of 135.5 kW can be compared with the ignition source during the experiments by Rowland and Smith [7], where an output ranging from 176 to 456 kW was applied.
In order to investigate the influence of the heat release rate of the initial fire source, a scenario with the double fuel size (with a heat release rate of 271 kW) as well as a scenario with a belt width of 1.2 m (with a heat release rate of 90.4 kW) were included.
2.3.2 Fuel Characteristics
Only the conveyor belt is accounted for in the modelling of the fire spread, thus any rollers, etc. are not included in the total heat release rate. It is assumed that the larger part of the combustible material along the belt will be composed of the actual conveyor belt.
An empty conveyor belt is assumed as any material on the belt in a non-coal mine will most likely be inert, acting as a heat sink and decreasing the flame spread velocity.
The heat release rate of a belt segment will vary as a function of the incident heat flux – among other parameters – and the following heat release rates were applied in the ensuing analysis:
The values were based on cone calorimeter experiments performed by Alvares et al. [8], where non-fire resistant light-duty conveyor belts were used.
The width of the conveyor belt will affect the view factor calculations and the radiative heat transfer, therefore affecting the flame spread velocity and heat release rate. Two different belt widths were applied during the analysis to investigate the impact: 1.2 m and 1.8 m respectively.
The time duration of the fire will be closely connected to the continuity of the fuel. Given the nature of the conveyor belt – with a distinct continuity of the fuel along the conveyor drift – the time duration may be considerable. Other than the fuel continuity (i.e. the length of the conveyor belt), the burning time of each ignited belt segment will also affect the time duration. The burning time will also influence the heat release rate of the fire and the length of the flame zone. The burning time of a belt segment will depend on the incident heat flux and the thickness of the belt. Two different belt thicknesses were applied during the analysis: 10 mm and 15 mm respectively.
For a heat release rate of 502 kW·m-2, the fire duration (until the fire entered a decay phase) for a 10 mm thick belt segment was calculated to approximately 700 s and approximately 1060 s for a 15 mm thick belt segment. These time durations are in line with the burning times measured by Lazzara and Perzak [20].
The following physical properties of the conveyor belt (styrene butadiene rubber) were applied during the analysis:
2.3.3 Surroundings
The geometrical dimensions of the conveyor drift affects the fire behaviour in the drift, where the height and width of the drift influences the flame length and therefore the flame spread velocity and the heat release rate. The following conveyor drift dimensions (height x width) were applied during the analysis: 3 x 3 m and 4 x 4 m respectively.
The distance between the belt and the roof will have a large impact on the resulting fire behaviour as pointed out in an earlier study [6]. A shorter distance between the belt and the roof may lead to deflected flames at an early stage, which will result in a rapid flame spread and a higher heat release rate. The distance between the belt and roof will also influence the flame length. The following distances were applied during the analysis: 0.2 m, 2 m and 3 m.
The ventilation flow also affects the fire behaviour in the conveyor drift, where an increase in the ventilation flow causes the flame to tilt further. An increasing flame tilt will cause the flame to get closer to the belt and cause a faster ignition. On the other hand, an increased ventilation flow velocity will also increase the mixing of hot fire gases with cooler air, decreasing the risk of fire spread caused by convective heating. The following ventilation flow velocities were applied during the analysis: 1.0 m·s-1, 1.5 m·s -1 and 2.0 m·s-1.
The inclination of a conveyor drift could possibly increase the flame tilt even further. Still, an earlier study where line fire experiments in a wind tunnel were performed showed that for 5° and 10° inclinations, the flame tilt angle was not influenced by the inclination and equalled the wind driven tilt angle [22]. Therefore, the inclination of the conveyor drift was not included in this study but a potential, future study could include the possible influence for inclinations larger than 10°.
Any suppression system along the conveyor belt will mitigate the effects of the fire, decreasing the flame spread velocity and heat release rate of the fire. Applying a conservative approach, no suppression systems or no activation of existing suppression system was assumed in the analysis.
2.3.4 Selection of Design Fire Scenarios
To investigate the impact of the different influencing parameters, a base scenario (scenario #1 in table 1) was defined. In the remaining design fire scenarios, one or two parameters were altered compared to the base scenario. The set of selected design fire scenarios with the specified input parameters can be found in table 1.
Table 1. Input parameters of the different design fire scenarios.
| Scenario # | Longitudinal ventilation velocity [m·s-1 ] | Size of ignition source [m2] | Belt width [m] | Belt thickness [mm] | Conveyor drift dimensions [m x m] | Distance between belt and roof [m] |
| 1 | 1.5 | 0.27 | 1.8 | 15 | 4 x 4 | 3 |
| 2 | 1.0 | 0.27 | 1.8 | 15 | 4 x 4 | 3 |
| 3 | 2.0 | 0.27 | 1.8 | 15 | 4 x 4 | 3 |
| 4 | 1.5 | 0.54 | 1.8 | 15 | 4 x 4 | 3 |
| 5 | 1.5 | 0.18 | 1.2 | 15 | 4 x 4 | 3 |
| 6 | 1.5 | 0.27 | 1.8 | 10 | 4 x 4 | 3 |
| 7 | 1.5 | 0.27 | 1.8 | 15 | 3 x 3 | 2 |
| 8 | 1.5 | 0.27 | 1.8 | 15 | 4 x 4 | 0.2 |
3. Methodology – Quantification Of The Design Fire Scenarios
The next step – after having decided what design fire scenarios to proceed with – would be to quantify the fires. Quantifying the fires includes the heat release rate, the fire growth rate and the flame spread velocity in this study.
A paper by Hansen [12] could serve as an aid when developing and summing up the total heat release rate curve of the individual fires in the conveyor belt segments. As the fire spread and ignition of the conveyor belt would take place in the direction of the longitudinal ventilation flow, the conveyor belts were divided into segments with a width equal to the belt width and a length of 0.15 m (equivalent to the length used for the ignition source). The ignition time of each belt segment was calculated applying the ignition model described in chapter 3.1 and the heat release rate of each belt segment was depicted as described in chapter 3.2. The heat release rate of each segment was initiated at the time of ignition and the total heat release rate of the entire conveyor belt was obtained by summing up the individual heat release rates of the belt segments at each time step.
3.1 Ignition model
Given that belt segments farther downstream of the fire will be pre-heated during a considerable time, the use of an ignition temperature as an ignition criterion would be appropriate. Applying the ignition temperature criterion will account for the heat progressively accumulated at the surface of adjacent belt segments. An ignition temperature of 360°C was assumed for the conveyor belt in the analysis [23].
With the ignition temperature criterion, the following expression for a thermally thick item could be used for calculating the accumulating belt surface temperature [24]:
where
k
is the thermal conductivity of the solid (W·m-1·K-1),
ρ
is the density of the solid (kg·m-3),
cp,fuel)
is the specific heat of the solid fuel (kJ·kg-1·K -1), ![]() is the net heat flux into the solid (kW·m-2) and
τ
are the intermediate time steps towards
t
(0 ≤ τ ≤ t)
.
is the net heat flux into the solid (kW·m-2) and
τ
are the intermediate time steps towards
t
(0 ≤ τ ≤ t)
.
A fire will be distinguished by a transient surface temperature for the various belt segments. By calculating the surface temperature numerically – using small time steps – the transient condition is fulfilled. A time step of 1 s was used in the calculations.
During the calculations, t was set to the point in time when ignition occurred: Ts(t) ≥ 360 ℃ . Thus, the time of ignition was pinpointed by trial to fulfil the surface temperature condition.
The flame radiation was assumed to dominate as heat transfer mechanism, which also was assumed in an earlier study on conveyor belts [2]. The following expression was applied when calculating the net heat flux into each belt segment:

where
Fflame-belt
is the view factor flames to the conveyor belt segment in question,
![]() is the total heat release rate of the fire (kW) and
Aflames
is the flame area of the fire (m2).
is the total heat release rate of the fire (kW) and
Aflames
is the flame area of the fire (m2).
The radiative fraction of the total heat release rate was set to 0.3 as can be seen in equation (2), assuming a general value in accordance with Cox [25].
The view factor algorithms applied were either the case with two rectangles with one common edge and included flame tilt angle ϕ [26] or two directly opposed rectangles (when flame deflection occurred) [27].
The transmissivity of the medium between the flame and the belt surface and the absorptivity of the belt surface were both set to 1 in the calculations which are conservative assumptions.
The convective and re-radiation losses from the belt surface were neglected in the analysis, based on the findings of Hansen [28].
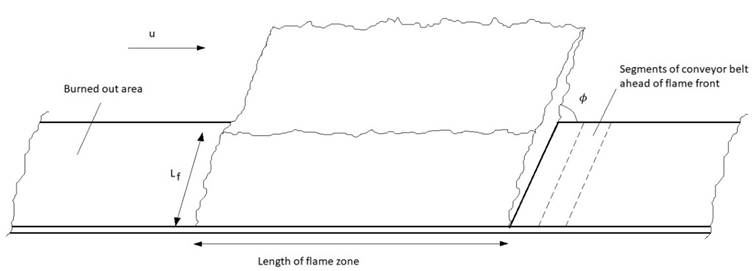
The flame volume along the conveyor belt is assumed to have the shape of a parallelepiped, see figure 2 for a sketch of the flame volume spreading along the conveyor belt in the direction of the longitudinal ventilation flow.
In order to obtain the flame areas, the flame length as well as the flame tilt angle will have to be calculated. The following correlations of Ingason and Li [29] have been found to match non-dimensional flame lengths from full-scale fire experiments in a mine:


where
Lf
is the flame length (m),
H
is the conveyor drift height (m),
![]() is the dimensionless heat release rate,
Pa
is the density of the ambient air (kg·m-3),
Cp
is the specific heat (kJ·kg-1·K-1),
Ta
is the ambient temperature (K),
A
is the cross-sectional area of the mine drift (m2) and
Hf
is the vertical distance between fire source centre and the conveyor
drift roof.
is the dimensionless heat release rate,
Pa
is the density of the ambient air (kg·m-3),
Cp
is the specific heat (kJ·kg-1·K-1),
Ta
is the ambient temperature (K),
A
is the cross-sectional area of the mine drift (m2) and
Hf
is the vertical distance between fire source centre and the conveyor
drift roof.
The following flame tilt angle relationships were developed for tunnel fires with longitudinal ventilation and validated against fire experiments [30]:


where ϕ is the flame tilt angle (degrees), V' is the dimensionless ventilation velocity, D is the diameter of the fire (m), V* is the dimensionless longitudinal velocity, u is the longitudinal velocity (m·s-1) and w* is the characteristic plume velocity.
In conveyor drifts where the distance between the belt and the roof is small and where the resulting fire causes long flame lengths, the flames may reach the roof and deflect along the roof in the ventilation flow direction. If flame deflection occurs, belt segments farther downstream will be exposed to an increased degree of flame radiation from the flames spreading underneath the roof.
The following expression was developed for tunnel fires with longitudinal ventilation flow [31]:

where Lf,deflect is the horizontal distance between the fire source and the flame tip underneath the roof of the conveyor drift (m).
During the calculations, Microsoft Office Excel spreadsheet software was used when employing the theoretical methodology.
3.2 Heat release rate of individual belt segments
As described in chapter 2.3.2, the heat release rate of a belt segment will vary as a function of the incident heat flux. Depending on the calculated incident heat flux at the belt segment prior to ignition, the peak heat release rate per unit area was set according to the values found in chapter 2.3.2.
The depiction of the heat release rate should be done in a realistic manner, applying an exponential function will have the advantage of depicting the heat release rate in a realistic smooth way instead of relying on unrealistic straight lines. An exponential function based upon the work by Numajiri and Furukawa [32] has been used in several earlier studies on heat release rates in underground mines [12, 33]. The exponential function could – after some modifications - also be applied to longer and constant sequences of heat release rates. Depending on the peak heat release rate and the total energy content of the belt segment, the appearance of the heat release rate curve will vary.
Heat release rate curves for the 15 mm thick conveyor belt cases (0.27 m2 large belt segments) using the exponential function can be found in figure 3.
4. Results and Discussion
When varying the longitudinal ventilation flow (see figure 4 for the resulting heat release rates), all three scenarios display an initial acceleration phase and a subsequent steady-state phase. This fire behaviour is typical of a line fire, i.e. entering a steady-state phase after an initial acceleration phase. The reason for the transition from an acceleration phase to a steady-state phase is due to the flames tilting less in the direction of fire spread as an increasing heat release rate will increase the buoyancy force of the fire and decrease the tilting of flame due to the longitudinal ventilation flow.
The sawtooth appearance of the heat release rate curves is due to the use of segments in the modelling, where each ignited belt segment will appear as a new sawtooth. Using smaller belt segments would result in smoother curves.
The increase in maximum heat release rate with increasing longitudinal ventilation velocity is clear if comparing scenario #2 (u=1.0 m·s-1) with scenario #1 (u=1.5 m·s-1) and scenario #3 (u=2.0 m·s-1) respectively. But the difference in maximum heat release rate between scenario #1 and #3 is less distinct and clearly the maximum heat release rate as a function of the longitudinal ventilation velocity is levelling off and approaching a peak value at approximately 2.0 m·s-1 for this specific set-up. This is in line with the findings of for example Rowland and Smith [7], where a peak value at u≈2.0 m·s-1 was found. If assuming a steady-state heat release rate of 1200 kW for the u=1.5 m·s-1 case, the duration of scenario #1 – until all the combustible material has been consumed - would be approximately 22 hours for a 100 m long conveyor belt. This time duration underlines the conveyor belt fires as considerably long lasting fires.
When comparing the fire growth rate of the three scenarios, it can be seen that the fire growth rate of scenario #1 and #3 are almost identical throughout most of the acceleration phase. Whereas, scenario #2 displays a lower fire growth rate at the early stages of the fire. Scenario #1 and #3 displays a fire growth rate of approximately 0.056 kW·s-2 during the initial two minutes, which would be regarded as a fast growing fire according to NFPA 204 [34]. The fire growth rate for the subsequent minutes until steady state is attained, is approximately 0.003 kW·s-2 and classified as a slow growing fire.
A fire with an initial fast fire growth – possibly affecting the early stages of the evacuation – and with a very long duration will have two unfavourable characteristics according to critical fire behaviours identified by Hansen [12].
The flame spread velocity of the three scenarios is found in figure 5. Initially the flame spread velocity of scenario #3 (u=2.0 m·s-1) is higher than the other two scenarios due to a higher degree of flame tilting. As the heat release rate of scenario #3 increases, the flame tilting decreases and the flame spread velocity as well. The flame spread velocity of scenario #3 occasionally displays slightly higher values compared with scenario #1 (u=1.5 m·s-1), which is explained by the fluctuations of the heat release rate. The flame spread velocity of scenario #2 (u=1.0 m·s-1) is somewhat lower than the other two scenarios, which is explained by the lower degree of flame tilting. As can be seen from figure 5, the flame spread velocity eventually becomes steady state, which is typical of a line fire with an upper limit on the fire width.
The maximum extension of the flame zone for the initial 20 minutes of the fire is identical for scenario #1 and #3, i.e. 1.65 m. The flame zone of scenario #2 is 1.35 m, which is not surprising given the lower flame spread velocity. Same as for the heat release rate and the flame spread velocity, the flame zone extension eventually enters a steady-state stage. This is in line with the experimental results of Lazzara and Perzak [20], where the flame zone maintained its length to the end of the belt and where not more than 1.5 to 2 m of the belt was burning at any one time.
Scenario #4 contained an ignition source twice as large in size and heat release rate compared with the other scenarios. Figure 6 displays the heat release rate of scenario #1 and #4. As can be seen, the larger ignition source will affect the heat release rate during the latter part of the acceleration phase where scenario #4 displays a higher heat release rate compared to scenario #1. This is explained by the initially smaller flame tilting of scenario #4, eventually increasing at the later stage of the acceleration. With further increasing time and distance from the ignition point, the effect will diminish and the difference in heat release rate of the two scenarios diminish as well. With increasing heat release rate of the ignition source, the longer the effect will linger. The trend with higher flame spread rate with higher heat release rate of the ignition source is in line with the finding of Yuan and Litton [6]. The ignition source used in the experiments by Wachowicz [3] consisted of 300 kg wood and burned with a peak heat release rate of approximately 3.5 MW, which seems like a bonfire type of ignition source. The peak heat release rate for the 42 m long belt of approximately 3.5 MW must clearly be attributed to the considerably large ignition source considering that the conveyor belt was most likely fire-resistant.
The belt width in scenario #5 was 1.2 m compared with 1.8 m in scenario #1. Figure 7 displays the flame spread velocity of scenario #5 and #1 and as can be seen the flame spread velocity of scenario #5 is higher than for scenario #1. The reason is due to the view factor for the 1.2 m wide belt is larger than the corresponding view factor of scenario #1. A larger portion of the flame radiation will be intercepted by the belt segments, increasing the incident heat flux and causing a more rapid ignition and flame spread velocity.
When studying the heat release rates of the two scenarios (see figure 8), it can be seen the heat release rate of scenario #5 is clearly lower than scenario #1. The higher flame spread velocities of scenario #5 will lead to faster ignition of belt segments, but with smaller width, the ignited segments will be smaller and lead to lower heat release rate. This is typical behaviour of a line fire with smaller fire width, i.e. attaining the maximum heat release rate at an early stage but resulting in a lower heat release rate.
In scenario #6 the belt thickness was decreased to 10 mm. When studying the resulting heat release rate with the corresponding development of scenario #1 (see figure 9), it can be seen that a decrease in the belt thickness will result in a lower heat release rate as the fire duration in each segment will be shorter. The lower heat release rate can also be realized by the lower energy content of each belt segment. The difference is visible after the initial acceleration phase. The shorter fire duration of the segments will be reflected in the fire duration of the entire conveyor belt. If assuming a steady state heat release rate of approximately 1000 kW as seen in figure 9, the total duration of scenario #6 would be approximately 18 hours for a 100 m long conveyor belt (compared with approximately 22 hours of scenario #1). The flame spread velocities from the experiments by Yuan and Litton [6] were found to be nearly the same for belts with different thicknesses with an ignition source of 14 kW, which fits the comparison between scenario #1 and #6.
The conveyor drift dimensions were decreased in scenario #7, which will affect the resulting flame length. A decrease in the conveyor drift height and width will lead to an increase in the flame length, which will result in a larger total flame area. The radiant heat flux from the flames will decrease due to a larger flame area for the same heat release rate, resulting in lower incident heat flux values ahead of the flame front, slower ignition, slower flame spread velocity and lower heat release rate as seen in figure 10. The reduction in heat release rate compared with scenario #1 is approximately 50% and very distinct.
With a decrease in the cross-sectional area of the conveyor drift comes the question whether the fire may be ventilation controlled and thus limiting the heat release rate? The following condition was applied when verifying [35]:


where
![]() is the mass flow rate of air (kg·s-1).
is the mass flow rate of air (kg·s-1).
For a conveyor drift with the cross-sectional dimensions of 3 x 3 m, a longitudinal ventilation velocity of 1.5 m·s-1 and a maximum heat release rate of approximately 800 kW, the fire is found to be fuel controlled and not ventilation controlled.
The distance between conveyor belt and roof has been the object of earlier studies on flame spread along conveyor belts [6]. When decreasing the distance between the belt and the roof from 3 m to 2 m (scenarios #1 and #7), the resulting flame length and total flame area increased. The increase in total flame area led to a decrease in the radiant heat flux from the flames. If decreasing the distance further to 0.2 m, flame deflection occurred after the ignition of the belt segment adjacent to the ignition source. An initial fire behaviour with low flame spread velocity and low heat release rate due to a lower radiant heat flux, changed into a fire where the flame deflection and flames along the roof led to considerably higher flame radiation levels at longer distances from the fire. Belt segments farther downstream are pre-heated to a greater degree, increasing the flame spread velocity and the heat release rate. As can be seen in figure 11, the fire in scenario #8 does not enter a steady-state phase as early as in scenario #1. Instead, the acceleration phase continues until a heat release rate of approximately 3 MW is attained before entering a steady-state phase. Applying equation (12), the fire was found to be fuel controlled at a heat release rate of 3 MW. The key factor for conveyor belt fires with higher heat release rates would be the occurrence of flame deflection if focusing on flame radiation as heat transfer mechanism. The occurrence of flame deflection will largely depend on the longitudinal ventilation velocity and the belt-to-roof distance. With increasing longitudinal ventilation velocity, the risk of flame deflection will decrease, as the flames will tilt closer to the belt surface. With an increasing belt-to-roof distance, the flame length will decrease and thus also the risk of flame deflection. These observations are in line with the findings of Yuan and Litton [6] regarding the coupling effect of the ventilation air velocity and the belt-to-roof distance on the flame spread velocity.
Given the description of the experiments performed by Rowland and Smith [7], flame deflection would most likely have occurred. The fire resulted in flashed over non-fire resistant conveyor belts and peak heat release rates of 10 and 11 MW.
A fire where flame deflection occurs may evolve into an extensive and fast growing fire as seen from figure 11. Hansen [12] pointed out this fire behaviour as critical and unfavourable, any sensitive surroundings nearby – such as a large number of personnel – could increase the fire risk significantly.
The earlier design fire scenarios have only accounted for the upper half of the conveyor belt. What would the heat release rate of for example scenario #1 be if also the lower half of conveyor belt participated in the fire? If assuming that the fire in the lower half starts to be noticeable at the time when the initially ignited belt segment enters a decaying phase (flames would have slowly spread against the ventilation flow direction, towards the lower belt), the resulting heat release rate curve can be seen in figure 12. The maximum heat release rate would be more than twice as high as the base scenario and the fire duration similar to the base scenario. This distinct increase is explained by the doubling of the available fuel load and energy content.
Several of the above developed design fire scenarios display a fire behaviour with a rapid fire growth rate at an early stage of the fire, an extensive and a fast growing fire, or a long lasting fire with continuous fire spread. Underlining the importance of considering and evaluating, the fire safety of non-fire resistant conveyor belts in conveyor drifts.
The design fire scenarios could serve as starting points when continuing the work with determining the impact of the potential fires and evaluating fire protection measures. The heat release rate of the fire scenarios could be used when calculating the smoke production and visibility in the conveyor drift, which in turn will be valuable when evaluating the egress safety of the conveyor drift.
The equations found and applied in this paper are commonly used when quantifying the fire behaviour in general but also specifically for mine fires or tunnel fires. The resulting trends and characteristics of the design fire scenarios have been validated whenever possible, using results from earlier, similar fire experiments. Studying the trends and characteristics, the focus will be on the qualitative results of the fire scenarios. To validate the specifically calculated heat release rates and flame spread velocities would require fire experiments performed under identical conditions. Thus, uncertainties exist with respect to the exact levels of the heat release rates and flame spread velocities. Several measures could be taken to reduce the uncertainties, such as using several design fire scenarios during the analysis – varying the input parameters – of a mine section to obtain a fuller picture of the resulting, worst credible fire behaviour.
5. Conclusions
A number of design fire scenarios for non-fire resistant conveyor belt fires in non-coal mines are developed, presented and discussed. The scenarios account for influencing parameters such as the longitudinal ventilation velocity, conveyor drift dimensions, conveyor belt width and thickness.
It was found that in all scenarios the fire started with an acceleration phase and transitioned to a steady-state phase, which is typical of a line fire. The transition to a steady-state phase occurs as the flames tilt less, as an increasing heat release rate will increase the buoyancy force of the fire.
The fire duration of conveyor belt fires was found to be considerable; a calculated fire duration of approximately 22 hours was presented for a 100 m long belt.
It was also found that the scenarios generally presented a fast fire growth rate during the initial acceleration phase, subsequently decreasing to a slower fire growth rate.
With an increasing ignition source, the heat release rate during the latter part of the acceleration phase was found to increase as well. With increasing time and distance from the ignition point, the effect will diminish.
With a decreasing belt width, the flame spread velocity was found to increase, which is caused by a larger portion of the flame radiation being intercepted by the belt segments.
A decrease in the belt thickness was found to have no effect on the flame spread velocity but instead led to a lower heat release rate as the fire duration in each segment will be shorter.
When the conveyor drift dimensions were decreased, the flame length increased which resulted in a decreased radiant heat flux and a slower flame spread rate and lower heat release rate.
With a decreasing belt-to-roof distance and a lower longitudinal ventilation velocity, the risk of flame deflection increases. If flame deflection occurs, an initial fire behaviour with low flame spread velocity and low heat release rate changes into a fire where the flames along the roof leads to considerably higher flame radiation levels at longer distances from the fire. Resulting in an increased flame spread velocity and heat release rate.
Providing design fire scenarios would improve the fire safety as well as the egress safety for mining personnel.
Acknowledgment
The author would like to thank and acknowledge the support from the Sustainable Minerals Institute, The University of Queensland.
References
[1] Y. Nakagawa, K. Takeshi and K. Makoto, “A Laboratory-scale Gallery Fire Test on Rubber Conveyor Belts with Fabric Skeletons”, Fire and Materials, vol. 15, pp. 17-26, 1991. View Article
[2] C.C. Hwang, C.D. Litton, F.J. Perzak and C.P. Lazzara, “Modeling the flow-assisted flame spread along conveyor belt surfaces”, Proceedings of the 5th U. S. Mine Ventilation Symposium, Society for Mining, Metallurgy, and Exploration , Inc. (SME), Littleton, CO, pp. 39-44, 1991.
[3] J. Wachowicz, “Heat Release Rate in Evaluation of Conveyor Belts in Full-Scale Fire Tests”, Fire and Materials, vol. 21, pp. 253-257, 1997. View Article
[4] A.R. Green and D.F. Fletcher, “A Numerical Study of Smoke Movement along an Inclined Coal Conveyor”, Fire Safety Science - Proceedings of the 5th International Symposium , pp. 1237-1248, 1997. View Article
[5] J. Wachowicz, “Investigations of Conveyor Belts Flammability. Comparison of Flammability Assessment using the Large-Scale Gallery Test and Cone Calorimeter”, Fire and Materials, vol. 22, pp. 213-218, 1998. View Article
[6] L. Yuan and C.D. Litton, “Experimental Study of Flame Spread on Conveyor Belts in a Small-scale Tunnel”, Fires and Materials 2007 - 10th International Conference , January 29-31, 2007. London: Interscience Communications, pp 1-10
[7] J.H. Rowland III and A.C. Smith, “Flammability of wider conveyor belts using large-scale fire tests”, Trans Soc Min Metal Explor, vol. 330, pp. 345-349, 2012.
[8] N. Alvares, H. Hasegawa and K. Staggs, “Ignition, Heat Release Rate and Suppression of Elastomeric Materials”, Fire Technology, vol. 52, pp. 1575-1593, 2016. View Article
[9] NFPA, SFPE Engineering Guide to Performance-Based Fire Protection, 2 nd Edition , NFPA, Quincy, 2007.
[10] Technical Committee ISO/TC, ISO 16733: Fire safety engineering – Selection of design fire scenarios and design fires , Technical Committee ISO/TC 92/SC 4, 2015
[11] R. Hansen, “Design fires in underground mines”, Mälardalen University, Västerås, Sweden, 2010.
[12] R. Hansen, “Design of fire scenarios for Australian underground hard rock mines – Applying data from full-scale fire experiments”, Journal of Sustainable Mining, vol. 18, pp. 163-173, 2019. View Article
[13] NFPA, NFPA 120 (Standard for Fire Prevention and Control in Coal Mines), National Fire Protection Association, Quincy, 2020.
[14] NFPA, NFPA 122 (Standard for Fire Prevention and Control in Metal/Nonmetal Mining and Metal Mineral Processing Facilities), National Fire Protection Association, Quincy, 2020.
[15] Mines Safety and Inspection Regulations 1995, Department of Justice, Government of Western Australia, 1995.
[16] Health and Safety (Mines and Petroleum Sites) Regulation 2014 , NSW Department of Communities and Justice, New South Wales Government, 2014.
[17] Coal Mining Safety and Health Regulation 2017, Office of the Queensland Parliamentary Counsel, Queensland Government, 2017.
[18] W.J. Francart, “Reducing belt entry fires in underground coal mines”, 11th U.S./North American Mine Ventilation Symposium, Mutmansky & Ramani (eds), 2006.
[19] R. Hansen, “Fire statistics from the mining industry in New South Wales, Queensland and Western Australia”, Minerals Industry Safety & Health Centre, The Sustainable Minerals Institute, The University of Queensland, 2017.
[20] C.P. Lazzara, and F.J. Perzak, “Effect of Ventilation on Conveyor Belt Fires”, Symposium on Safety in Coal Mining, Paper 7.5, Pretoria, South Africa, Oct. 1987.
[21] Polymer Handbook, 4th edition, editors: Brandup J, Immergut E.H. & Grulke E.A., Wiley, 1998.
[22] F. Morandini, P.A. Santoni, J.H. Balbi, J.M.Ventura and J.M. Mendes-Lopes, “A two-dimensional model of fire spread across a fuel bed including wind combined with slope conditions”, International Journal of Wildland Fire, vol. 11, pp. 53-64, 2002. View Article
[23] V. Babrauskas, Ignition Handbook, Fire Science Publishers, Issaquah, 2003.
[24] V. Babrauskas and S.J. Grayson, Heat Release in Fires, Chapman and Hall, London, 1992.
[25] G. Cox, Combustion fundamentals of fire, Academic Press, London, 1995.
[26] E.M. Sparrow, “A new and simpler formulation for radiative angle factors”, J. Heat Transfer, vol. 85, pp. 81-88, 1962. View Article
[27] H.C. Hottel, “Radiant heat transmission between surfaces separated by non-absorbing media”, Trans. ASME, vol. 53, FSP-53-196, pp. 265-273, 1931.
[28] R. Hansen, “Study of heat release rates of mining vehicles in underground hard rock mines”, Ph.D. dissertation, Västerås: Mälardalen University; 2015.
[29] H. Ingason and Y.Z. Li, “Model scale tunnel fire tests with longitudinal ventilation”, Fire Safety Journal, vol. 45, pp. 371–84, 2010. View Article
[30] Y.Z. Li and H. Ingason, “Maximum ceiling temperature in a tunnel fire”, SP Report 2010:51, Borås: SP Swedish National Testing and Research Institute; 2010.
[31] Y.Z. Li and H. Ingason, “Fire-induced ceiling jet characteristics in tunnels under different ventilation conditions”, SP Report 2015:23, Borås: SP Swedish National Testing and Research Institute; 2015.
[32] F. Numajiri and K. Furukawa, “Short Communication: Mathematical Expression of Heat Release Rate Curve and Proposal of ‘Burning Index’”, Fire and Materials, vol. 22, pp. 39–42, 1998. View Article
[33] R. Hansen, “Analysis of Methodologies for Calculating the Heat Release Rates of Mining Vehicle Fires in Underground Mines”, Fire Safety Journal, vol. 71, pp.194–216, 2015 View Article
[34] NFPA, Standard for smoke and heat venting. Quincy, MA: National Fire Protection Association; 2015.
[35] A. Beard and R. Carvel, The handbook of tunnel fire safety. London: Thomas Telford Ltd, 2005. View Article